Would you like to learn how to perform a Prometheus docker monitoring configuration on Ubuntu Linux? In this tutorial, we are going to show you how to install Prometheus on Ubuntu Linux, how to configure Prometheus to perform docker monitoring and how to access your Prometheus web administration interface.
• Ubuntu version: 18.04
• Prometheus version: 2.8.0
• Docker version: 18.09.2
In our example, the Docker server uses the IP address 35.163.249.161.
In our example, the Prometheus server uses the IP address 34.216.84.149.
Keep in mind that you need to change the commands and configuration files to reflect your environment.
What is Prometheus?
Prometheus is an open-source monitoring platform that is able to collect metrics from monitored targets by scraping metrics.
After saving the collected data, a network administrator is able to query it using its query language and render all the results into graphs.
Prometheus comes with a web server that allows it to be accessed from anywhere.
Prometheus Tutorial:
On this page, we offer quick access to a list of Prometheus tutorials.
Tutorial - Docker Monitor Configuration
These tasks should be performed on the computer that is running the Docker service.
On the Linux console, install the docker service.
# apt-get update
# apt-get install docker.io
Create a daemon.json file inside the /etc/docker directory.
# vi /etc/docker/daemon.json
Here is the daemon.json file content.
Restart the Docker service.
Verify if the 9323 port is open for connections.
# service docker restart
# netstat -nl | grep 9323
Congratulations! You have successfully installed Docker and configured the Docker metrics-address feature.
Tutorial - Prometheus Install
These tasks should be performed on the computer that will become the Prometheus server.
On the Linux console, create a Prometheus user account.
# groupadd --system prometheus
# useradd -s /bin/false -r -g prometheus prometheus
Create the Prometheus required directories.
# mkdir /etc/prometheus
# mkdir /var/lib/prometheus
Perform the Prometheus download.
# mkdir /downloads/prometheus -p
# cd /downloads/prometheus
# wget https://github.com/prometheus/prometheus/releases/download/v2.8.0/prometheus-2.8.0.linux-amd64.tar.gz
Extract and Install Prometheus monitoring package.
# tar -zxvf prometheus-2.8.0.linux-amd64.tar.gz
# cd prometheus-2.8.0.linux-amd64/
# install prometheus /usr/local/bin/
# install promtool /usr/local/bin/
# mv consoles /etc/prometheus/
# mv console_libraries /etc/prometheus/
Create a Prometheus configuration file.
# cd /etc/prometheus
# vi prometheus.yml
Here is the Prometheus.yml file content.
In our example, we are assuming that the Docker server IP address is 35.163.249.161.
Keep in mind that you need to change the Docker server IP address to reflect your environment.
Set the correct permission on Prometheus installation files.
# chown prometheus:prometheus /usr/local/bin/prometheus
# chown prometheus:prometheus /usr/local/bin/promtool
# chown prometheus:prometheus /var/lib/prometheus -R
# chown prometheus:prometheus /etc/prometheus -R
# chmod -R 775 /etc/prometheus/ /var/lib/prometheus/
Use the following command to start Prometheus manually.
# prometheus --config.file /etc/prometheus/prometheus.yml --storage.tsdb.path /var/lib/prometheus/ --web.console.templates=/etc/prometheus/consoles --web.console.libraries=/etc/prometheus/console_libraries
Prometheus Startup Script.
Create a Prometheus startup script.
# vi /etc/systemd/system/prometheus.service
Here is the content of the prometheus.service file.
Enable the Prometheus service to start during the computer boot.
# chown prometheus:prometheus /var/lib/prometheus -R
# chmod 775 /var/lib/prometheus -R
# systemctl daemon-reload
# systemctl enable prometheus
# systemctl start prometheus
Prometheus Dashboard Access
Open your browser and enter the IP address of your server plus :9090
In our example, the following URL was entered in the Browser:
• http://34.216.84.149:9090
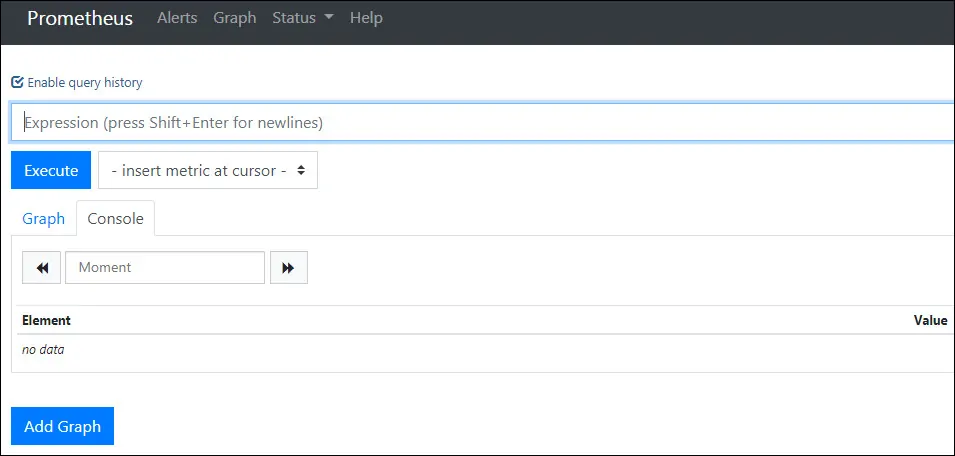
The Prometheus web interface should be presented.
On the Prometheus query textbox, enter the string mysql to test the communication with mysqld_exporter.

Congratulation! You have successfully performed a Prometheus installation on Ubuntu Linux.
Prometheus Targets
Open your browser and enter the IP address of your server plus :9090/targets
In our example, the following URL was entered in the Browser:
• http://34.216.84.149:9090/targets
The Prometheus target web interface should be presented.

Click on the Prometheus Docker target link to verify all metrics available for docker monitoring.

Leave A Comment
You must be logged in to post a comment.