Would you like to learn how to use the Cacti Ping monitor feature? In this tutorial, we are going to show you how to configure Cacti to monitor a Host using ICMP packages.
• Ubuntu 19.04
• Cacti 1.2.3
What is Cacti?
Cacti is an open-source platform for data monitoring that is completely PHP driven.
On the Web interface, users are able to use Cacti as a frontend to RRDtool, create Graphs and populate them with data stored in MySQL.
Cacti also has SNMP support for users to create graphs in order to perform network monitor.
Cacti Playlist:
On this page, we offer quick access to a list of videos related to Cacti installation.
Don't forget to subscribe to our youtube channel named FKIT.
Cacti Tutorial:
On this page, we offer quick access to a list of Cacti tutorials
Tutorial Cacti - Ping Monitoring
First, you need to access the Cacti server dashboard and add a device to monitor using ICMP Ping.
Open your browser and enter the IP address of your web server plus /cacti.
In our example, the following URL was entered in the Browser:
• http://35.162.85.57/cacti
On the login screen, use the default username and default password.
• Default Username: admin
• Default Password: admin
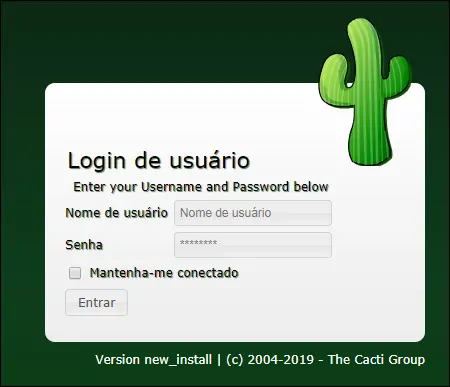
After a successful login, you will be sent to the Cacti Dashboard.
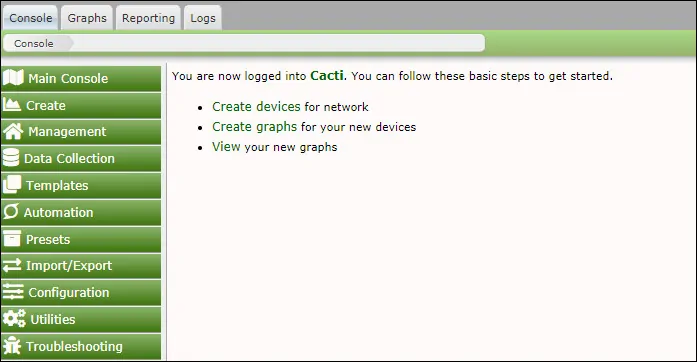
On the Cacti dashboard screen, access the Configuration menu and select the Devices option.
Click on the plus sign on the top right part of the screen to add a new device.

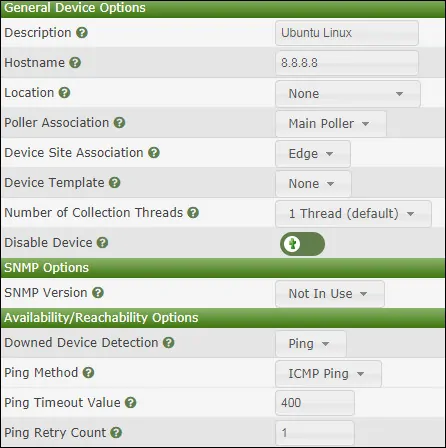
Perform the following configuration and click on the Create button.
• Description - Enter a description
• Hostname - Enter the IP address of your device.
• Device Template - None
• SNMP Version - Not in use
• Downed Device Detection - Ping
• Ping Method - ICMP Ping
• Ping Timeout Value - 400
• Ping Retry Count - 1
On the top right part of the screen, click on the option named: Create Graphs for this Device

Select the template named Unix Ping latency and click on the create button.

Go to the Management menu and select the Devices options.
Wait 5 minutes and check if your device or server was added to the list.

Cacti - Configure a Graph Tree
Go to the Management menu and select the Trees options.
Click on the plus sign on the top right part of the screen to add a new tree.

Add a description and click on the Create button.

On the Tree properties screen, click on the Edit tree properties button.
Enable the Publish option.
Drag the desired device or specific graph to the left part of the screen.
Click on the Save button.
Click on the finish editing the tree button.
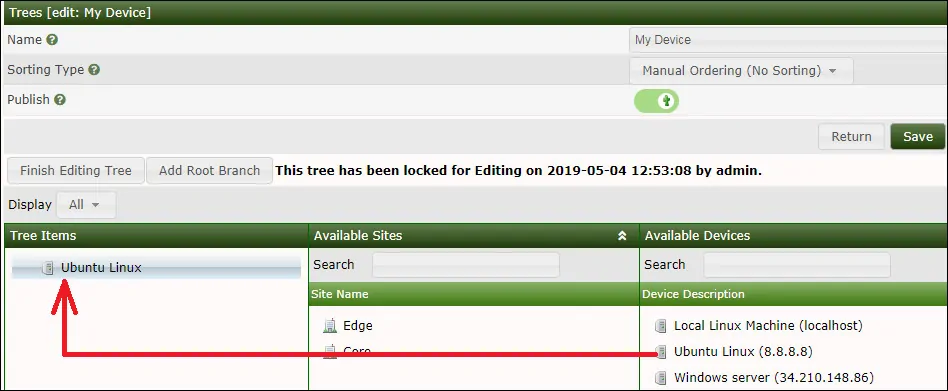
The Cacti tree configuration was finished.
Cacti - Network Monitor using Ping
Select the Graphs tab on the top left part of the screen.
Locate the desired Cacti tree where your device was included.
Click on device name that you configured to the device.
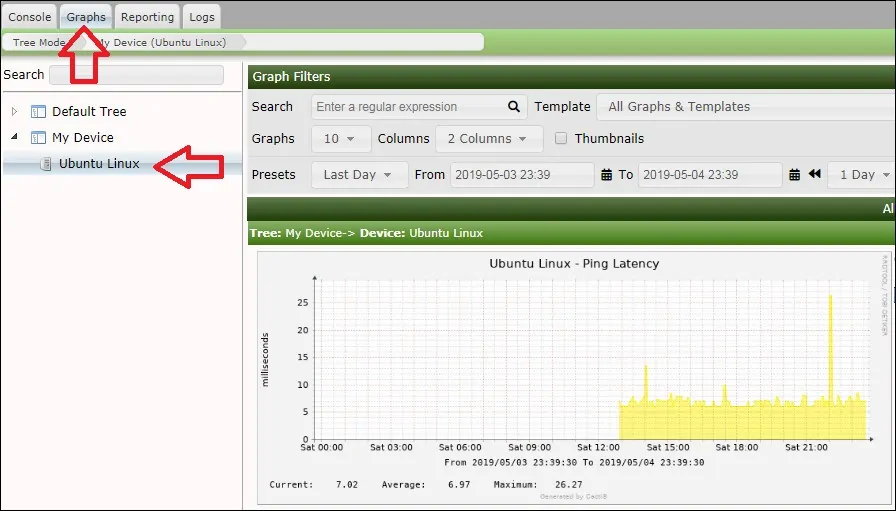
You are now able to use Cacti as a ping network monitor solution.
