Would you like to learn how to perform Vmware monitoring using Cacti? In this tutorial, we are going to show you how to monitor a Vmware ESXI using Cacti and Spine.
• Ubuntu 18.04
• Ubuntu 19.04
• Cacti 1.2.3
• Vmware ESXi 6.7
What is Cacti?
Cacti is an open-source platform for data monitoring that is completely PHP driven.
On the Web interface, users are able to use Cacti as a frontend to RRDtool, create Graphs and populate them with data stored in MySQL.
Cacti also has SNMP support for users to create graphs in order to perform network monitor.
Cacti Playlist:
On this page, we offer quick access to a list of videos related to Cacti installation.
Don't forget to subscribe to our youtube channel named FKIT.
Cacti Tutorial:
On this page, we offer quick access to a list of Cacti tutorials
Cacti - Vmware SNMP Configuration
We are going to enable and configure the SNMP service on a computer running Vmware ESXi.
First, you need to access the Vmware web interface.
Open a browser software, enter the IP address of your Vmware ESXi server and access web interface.

On the prompt screen, enter the administrative login information.
Factory default access information:
• Username: root
• Password:
After a successful login, the Vmware dashboard will be displayed.
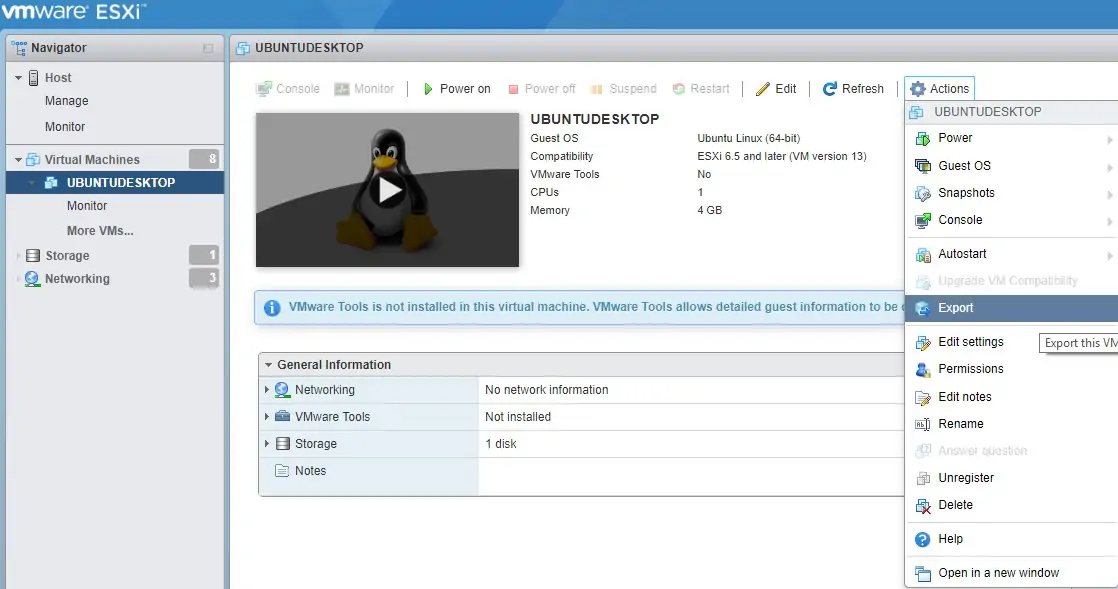
Now, you need to enable the SSH service.
Access the Manage menu, access the Services tab and locate the SSH service.
• Manage > Services > TSM-SSH
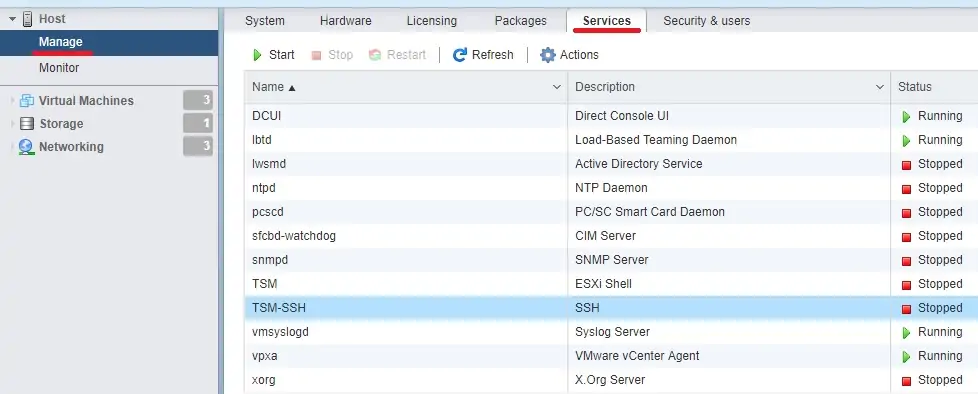
Right click on the SSH service and select the start option.
Now, you need to access the Vmware ESXi server using SSH.
In our example, we are going to use an Opensource software named Putty and a computer running Windows.
The Putty software is available on the putty.org website.
After finishing the download, run the software and wait for the following screen.
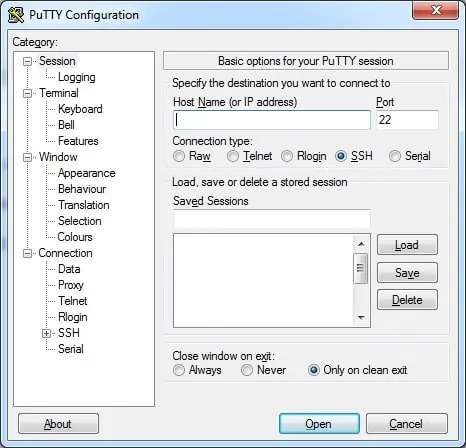
Select the SSH option and enter the IP address of the VMWare ESXi server.
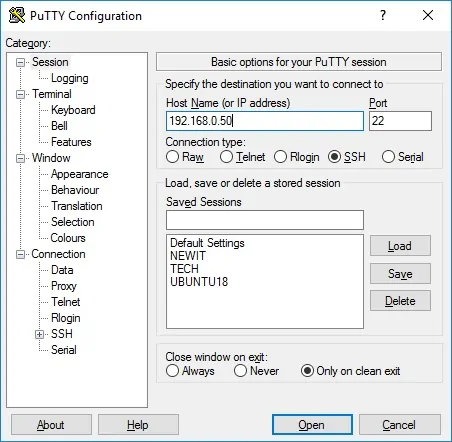
On the prompt screen, enter the administrative login information.
Factory default access information:
• Username: root
• Password:
After a successful login, the console command-line will be displayed.
Use the following commands to configure SNMP on Vmware ESXI 6.7.
# esxcli system snmp set --communities Tech2Monitor
# esxcli system snmp set --syscontact="Vegeto <vegeta@techexpert.tips>"
# esxcli system snmp set --syslocation="Planet Salad"
# esxcli system snmp set --enable true
In our example, we used the SNMP community name Tech2Monitor.
In our example, we used the SNMP location planet Salad.
In our example, we used the SNMP Contact Vegeto.
You need to change our configuration to reflect your environment.
On the cacti server, use the following commands to test the SNMP communication.
# apt-get install snmp
# snmpwalk -v2c -c Tech2Monitor 192.168.0.50
Here is a small sample of the snmpwalk command output.
iso.3.6.1.2.1.1.4.0 = STRING: "Vegeto <vegeta@techexpert.tips>;"
iso.3.6.1.2.1.1.5.0 = STRING: "ip-172-31-38-253"
iso.3.6.1.2.1.1.6.0 = STRING: "planet Salad"
iso.3.6.1.2.1.1.8.0 = Timeticks: (0) 0:00:00.00
You have successfully configured the SNMP service on Vmware ESXi.
You are now able to use network monitoring tools like Cacti to get remote information from the Vmware server.
Tutorial - Monitor Vmware ESXI using Cacti and SNMP
Now, we need to access the Cacti server dashboard and add the Vmware ESXI as a Host.
Open your browser and enter the IP address of your web server plus /cacti.
In our example, the following URL was entered in the Browser:
• http://35.162.85.57/cacti
On the login screen, use the default username and default password.
• Default Username: admin
• Default Password: admin
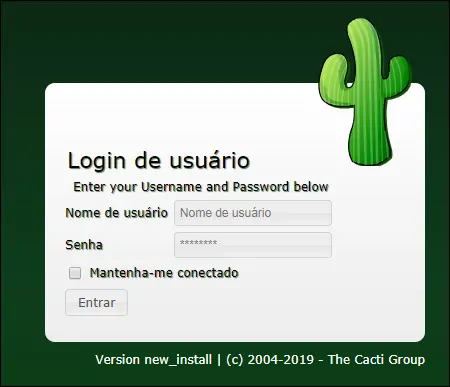
After a successful login, you will be sent to the Cacti Dashboard.
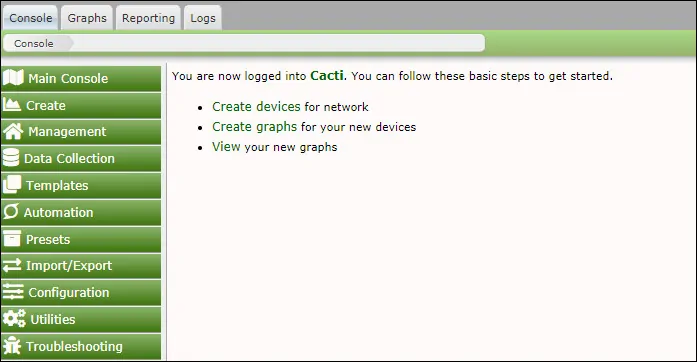
On the Cacti dashboard screen, access the Configuration menu and select the Devices option.
Click on the plus sign on the top right part of the screen to add a new device.

Perform the following configuration and click on the Create button.
• Description - Enter a description
• Hostname - Enter the IP address of your Vmware server
• Device Template - Net-SNMP Device
• SNMP Version - 2
• Downed Device Detection - SNMP Uptime
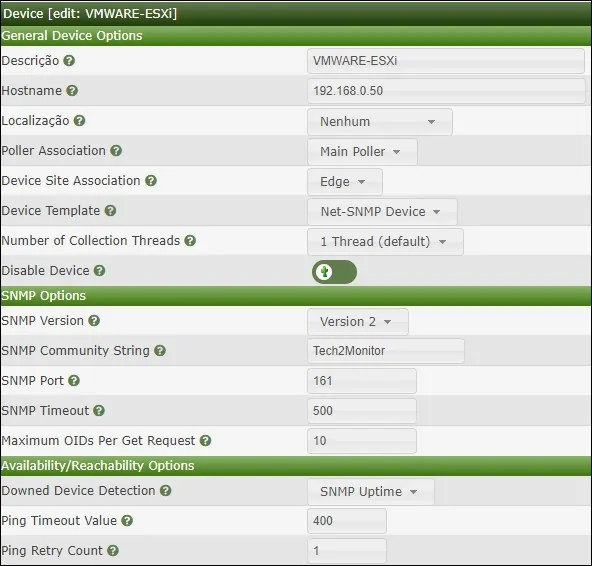
Click on the Create button.
On the top of the screen, click on the option: Create graphs for this device

Select the template that meets your network monitoring needs

Select the desired disk partitions.
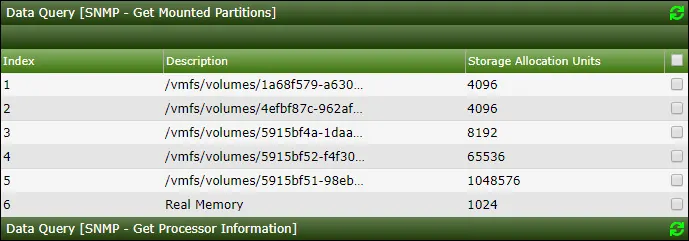
Select the desired processors.
Select the desired network interfaces.

Important! On the bottom right part of the screen, select the option named: In/Out Bits (64-bit)
Click on the Create button located on the bottom-right part of the screen.
Go to the Management menu and select the Devices options.
Wait 5 minutes and check if your Vmware ESXi server device was added to the list.

Configure Cacti Graph Tree
Go to the Management menu and select the Trees options.
Click on the plus sign on the top right part of the screen to add a new tree.

Add a description and click on the Create button.

On the Tree properties screen, click on the Edit tree properties button.
Enable the Publish option.
Drag the desired device or specific graph to the left part of the screen.
Click on the Save button.
Click on the finish editing the tree button.

The Cacti tree configuration was finished.
Cacti Monitoring Vmware Server
Select the Graphs tab on the top left part of the screen.
Locate the desired Cacti tree where the Vmware server was included.
Click on the device name that you configured to the Vmware ESXi server.
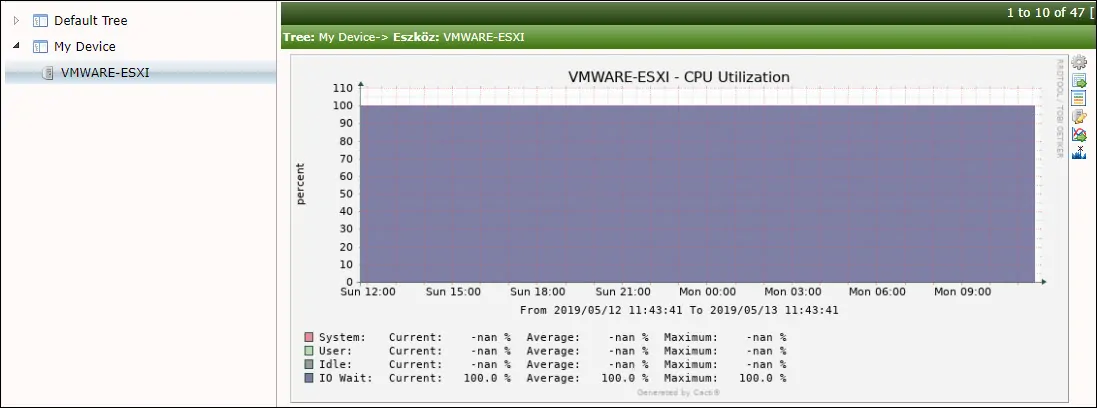
You are now able to use Cacti as a network monitor solution to monitor Vmware servers using SNMP.
