Would you like to learn how to perform a Grafana Zabbix integration using Grafana plugins? In this Grafana tutorial, we are going to show you how to install and configure Grafana Dashboards for Zabbix for the first time.
What is Grafana?
Grafana is an open-source platform for data monitoring, analysis, and visualization that comes with a web server that allows it to be accessed from anywhere.
On the Web interface, users are able to create Grafana dashboards with panels to represent metrics over time.
Grafana Tutorial:
On this page, we offer quick access to a list of Grafana tutorial:
Grafana Tutorial - Grafana Zabbix Integration
We will assume that you have a functional Grafana and Zabbix installation running.
On the Grafana server console, use the following commands to list all Grafana plugins.
Use the following command to install the Grafana Zabbix plugin.
After finishing the Grafana plugin installation, restart the Grafana service.
# grafana-cli plugins list-remote
# grafana-cli plugins install alexanderzobnin-zabbix-app
# service grafana-server restart
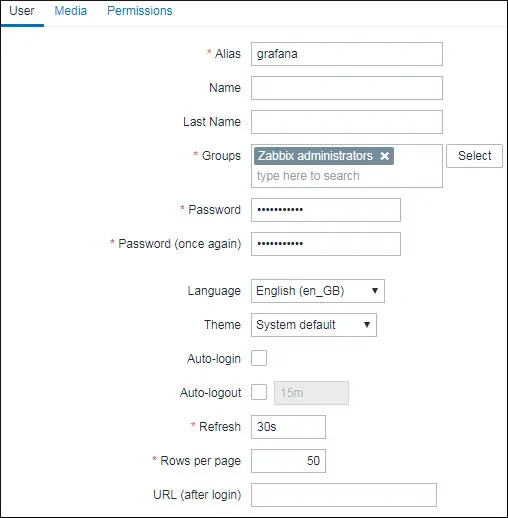
On the Zabbix dashboard, access the Administration menu and select the Users option.

Click on the Create user button.
Configure a new user account as member os the Zabbix Administrators group.
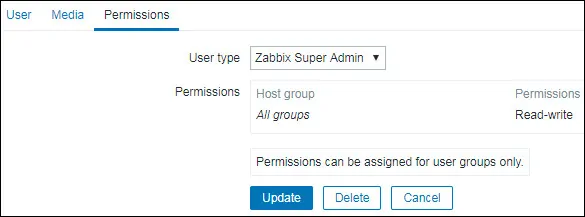
Access the Permissions tab and select the Zabbix super Admin option.
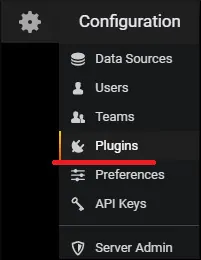
On the Grafana dashboard, access the Grafana plugins menu.
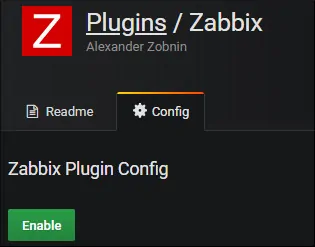
Enable the Grafana Zabbix plugin.
On the Grafana dashboard, access the Grafana Data sources menu.
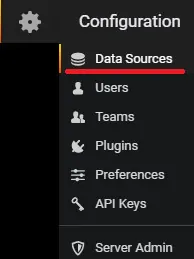
Add a Zabbix Data source.
On the Zabbix data source configuration page, you need to perform the following configuration:
Enter the correct URL to the Zabbix api_jsonrpc.php file.

In our example, we entered the following URL:
http://34.220.49.29/zabbix/api_jsonrpc.php
Next, you need to select the Zabbix version that Grafana is connecting and enter the Zabbix login information.
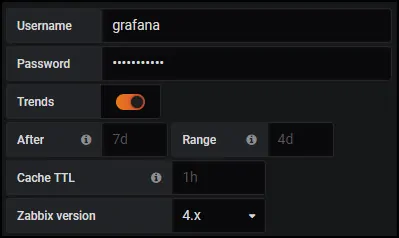
In our example, we enabled the Trends option.
In our example, we selected Zabbix version 4.
In our example, we entered the Zabbix account grafana and the password kamisama123.
Click on the Add button to finish the data source configuration and test the Zabbix connection.
Grafana Dashboard Example - Zabbix Dashboards
Now, we need to add theGrafana dashboard for Zabbix.
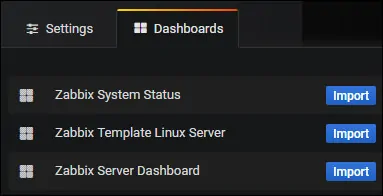
On the Zabbix data source configuration screen, access the Dashboards tab.
Import 3 Zabbix dashboards examples offered by the Zabbix plugin.
To access the Zabbix dashboard, you need to access the Grafana Dashboards menu option.
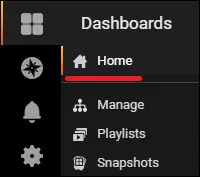
On the top of the screen, search for Dashboards named Zabbix.

Select the Zabbix Server Dashboard.
Here is an example of the Zabbix dashboard.
On the top of the screen, search for Dashboards named Zabbix.
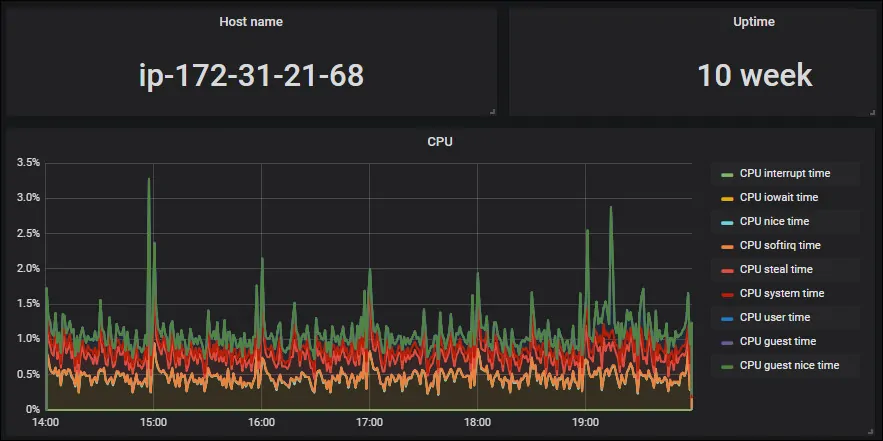
Congratulations! You have integrated Zabbix to Grafana successfully.

Leave A Comment
You must be logged in to post a comment.