Would you like to learn how to install Grafana on a computer running Ubuntu Linux on the Amazon AWS cloud? In this tutorial, we are going to show you how to create a new account at Amazon AWS, how to create an Ubuntu virtual machine instance and how to perform the Grafana installation on a new virtual machine on the Amazon EC2 cloud.
What is Grafana?
Grafana is an open-source platform for data monitoring, analysis, and visualization that comes with a web server that allows it to be accessed from anywhere.
On the Web interface, users are able to create Grafana dashboards with panels to represent metrics over time.
Grafana Tutorial:
On this page, we offer quick access to a list of Grafana tutorials.
Tutorial - How to Create a Key Pair
To access a Linux Virtual Machine on AWS, first, you need to create a private Key.
Open your browser, access the Amazon AWS website and enter your login information.
After a successful login, you will be sent to the AWS Dashboard.
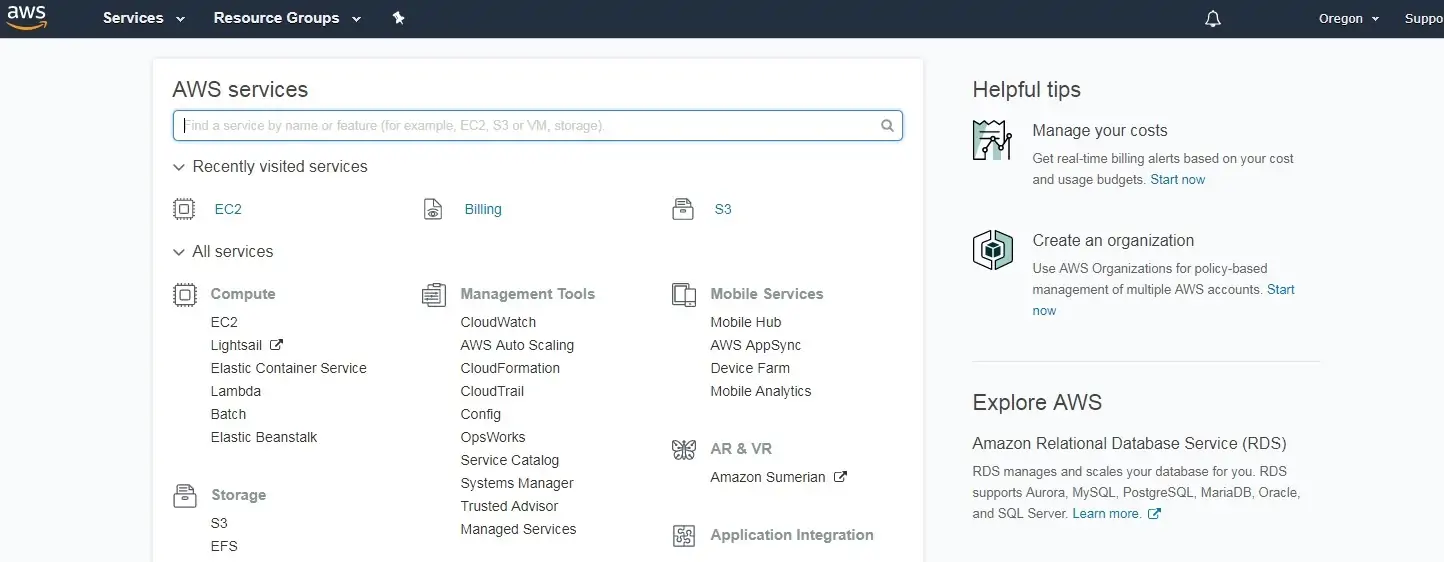
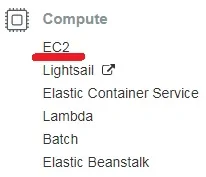
Access the COMPUTE menu and select the EC2 option.
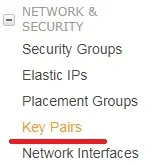
On the EC2 Dashboard, access the Network & Security menu and click on the Key Pairs option.
On the Key Pairs screen, click on the Create Key Pair button.
You will have to enter a name to the new Key Pair.
You will have to save locally your private key.
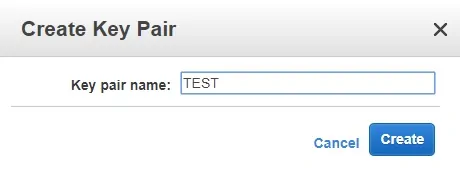
In our example, we created a key pair named TEST.
In our example, we saved a file named TEST.PEM.
Tutorial - How to Create an AWS EC2 Ubuntu
On the EC2 Dashboard, access the Instances menu and click on the Instances option.
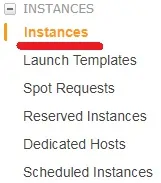
On the EC2 Instance screen, click on the Launch Instance button.

Now, it is time to select the desired Operational system image.
On the list presented, locate and select the Ubuntu Linux image.

As the second step, you will have to select the type of virtual machine that will run the Ubuntu Linux.
Basically, you will select the number of processors and the amount of RAM that you want.

If you do not want to specify the amount of hard disk available to this virtual machine, click on the Review and Launch button.
If you want to specify the amount of hard disk available to this virtual machine, click on the Configure instance detail button.
On the summary screen, click on the Launch button.

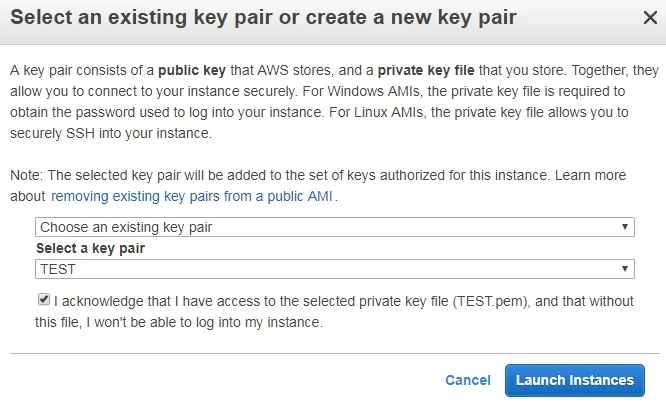
Select the Key pair authorized to connect to the new virtual machine and click on the Launch Instances.
In our example, the key pair named TEST was selected.
On the EC2 Dashboard, access the Instances menu and click on the Instances option.
As you can see a new virtual machine was created.

In our example, the virtual machine got the Dynamic IP address: 34.217.14.140
Tutorial - How to Access an AWS Ubuntu
To access the Linux virtual machine you will have to download the following software:
• Putty
• PuttyGen
First, we need to convert the private key from the PEM format to the PPK format.
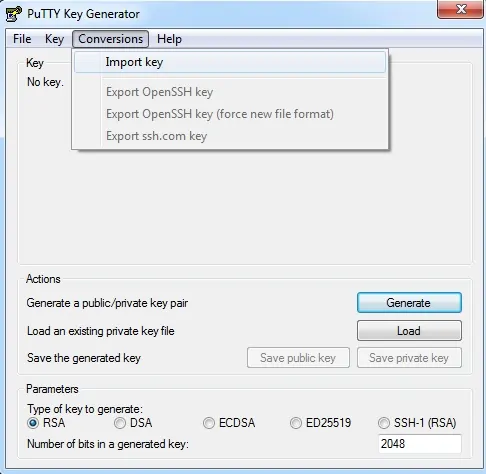
Open the PuttyGen software, access the Conversions menu and select the Import key.
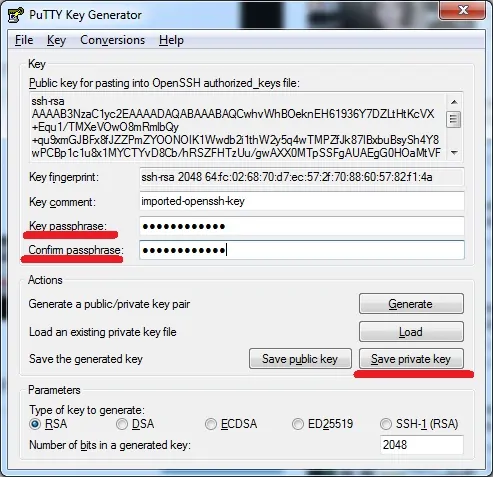
After importing the PEM file, you need to set a password to protect your private key.
Click on the Save private key button to generate a file with the PPK extension.
In our example, a file named TEST.PPK was created.
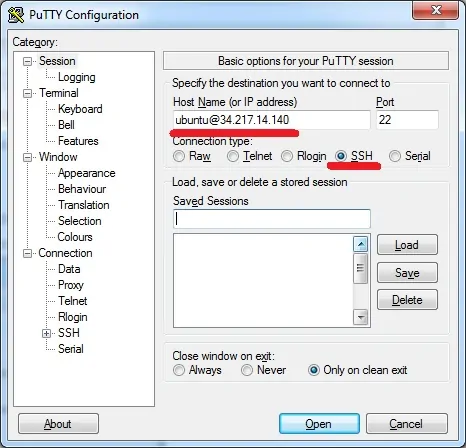
Open the Putty software, select the SSH option and enter the username ubuntu@ followed by the IP address of the AWS virtual machine.
In our example, we used ubuntu@34.217.14.140.
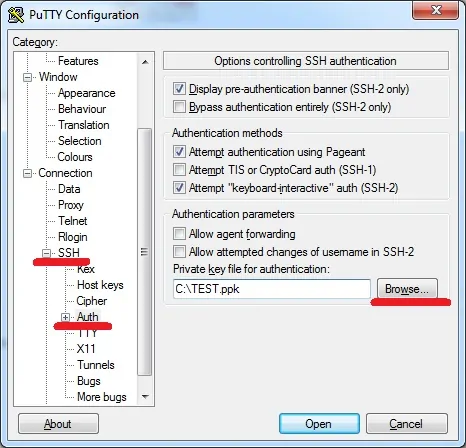
Access the SSH authentication tab, click on the Browse button, locate the PPK file and click on the Open button.
An SSH connection will be started with your Ubuntu virtual machine.
Use the following command to become the root user on the Ubuntu virtual machine.
You have successfully created an Ubuntu virtual Machine on Amazon AWS.
Tutorial - Grafana Install
On the Linux console, use the following commands to install the MySQL database service.
# apt-get update
# apt-get install mysql-server
Use the following command to access the MySQL command-line.
# mysql -u root -p
Use the following SQL command to create a database named grafana.
CREATE DATABASE grafana CHARACTER SET UTF8 COLLATE UTF8_BIN;
Use the following SQL command to create a database user named grafana.
CREATE USER 'grafana'@'%' IDENTIFIED BY 'kamisama123';
Give the SQL user named grafana permission over the database named grafana.
GRANT ALL PRIVILEGES ON grafana.* TO 'grafana'@'%';
quit;
On the Linux console, use the following commands to configure the Grafana APT repository.
# mkdir /downloads/grafana -p
# cd /downloads/grafana
# wget https://packages.grafana.com/gpg.key
# apt-key add gpg.key
# add-apt-repository 'deb [arch=amd64,i386] https://packages.grafana.com/oss/deb stable main'
# apt-get update
Use the following command to install Grafana.
# apt-get install grafana
Edit the Grafana configuration file grafana.ini.
# vi /etc/grafana/grafana.ini
Perform the following configuration under the [Database] and [Session] sections.
[database]
type = mysql
host = 127.0.0.1:3306
name = grafana
user = grafana
password = kamisama123
[session]
provider = mysql
provider_config = `grafana:kamisama123@tcp(127.0.0.1:3306)/grafana`
Keep in mind that you need to change the MySQL username and password to reflect your environment.
Use the following command to start the Grafana service.
# service grafana-server start
The Grafana service will start listening on TCP port 3000.
Use the following command to see Grafana logs and verify if everything is working.
# cat /var/log/grafana/grafana.log
t=2019-03-24T01:50:56+0000 lvl=info msg="Initializing ServerLockService" logger=server
t=2019-03-24T01:50:56+0000 lvl=info msg="Initializing UsageStatsService" logger=server
t=2019-03-24T01:50:56+0000 lvl=info msg="Initializing UserAuthTokenService" logger=server
t=2019-03-24T01:50:56+0000 lvl=info msg="Initializing CleanUpService" logger=server
t=2019-03-24T01:50:56+0000 lvl=info msg="Initializing NotificationService" logger=server
t=2019-03-24T01:50:56+0000 lvl=info msg="Initializing ProvisioningService" logger=server
t=2019-03-24T01:50:56+0000 lvl=info msg="Initializing TracingService" logger=server
t=2019-03-24T01:50:56+0000 lvl=info msg="Initializing Stream Manager"
t=2019-03-24T01:50:56+0000 lvl=info msg="HTTP Server Listen" logger=http.server address=0.0.0.0:3000 protocol=http subUrl= socket=
t=2019-03-24T01:50:57+0000 lvl=info msg="cleanup of expired auth tokens done" logger=auth count=0
Grafana Dashboard Login
Open your browser and enter the IP address of your server plus :3000.
In our example, the following URL was entered in the Browser:
• http://34.217.14.140:3000
The Grafana web interface should be presented.

On the prompt screen, enter the Grafana Default Password login information.
• Username: admin
• Password: admin
The system will ask you to change the Grafana default password.

After a successful login using the new password, the Grafana dashboard will be displayed.

If you want to start Grafana during boot time, use the following command:
# systemctl enable grafana-server.service
Synchronizing state of grafana-server.service with SysV service script with /lib/systemd/systemd-sysv-install.
Executing: /lib/systemd/systemd-sysv-install enable grafana-server
Created symlink /etc/systemd/system/multi-user.target.wants/grafana-server.service → /usr/lib/systemd/system/grafana-server.service.
Use the following command to check the status of the Grafana service.
# systemctl status grafana-server.service
Here is an example of the Grafana service status output
● grafana-server.service - Grafana instance
Loaded: loaded (/usr/lib/systemd/system/grafana-server.service; enabled; vendor preset: enabled)
Active: active (running) since Sun 2019-03-24 02:13:58 UTC; 2min 15s ago
Docs: http://docs.grafana.org
Main PID: 758 (grafana-server)
Tasks: 9 (limit: 1152)
CGroup: /system.slice/grafana-server.service
└─758 /usr/sbin/grafana-server --config=/etc/grafana/grafana.ini --pidfile=/var/run/grafana/grafana-server.pid --packaging=deb cfg:default.paths.logs=/var/log/grafana cfg:default.paths.d
Congratulations! You have successfully created a Grafana installation on Ubuntu Linux.
