Would you like to learn how to configure Grafana LDAP authentication on Active directory? In this tutorial, we are going to show you how to authenticate Grafana users using the Microsoft Windows database Active directory and the LDAP protocol.
• Ubuntu 18.04
• Ubuntu 19.04
• Grafana 6.0.2
What is Grafana?
Grafana is an open-source platform for data monitoring, analysis, and visualization that comes with a web server that allows it to be accessed from anywhere.
On the Web interface, users are able to create Grafana dashboards with panels to represent metrics over time.
Grafana Tutorial:
On this page, we offer quick access to a list of Grafana tutorials.
Tutorial - Windows Domain Controller Firewall
First, we need to create a Firewall rule on the Windows domain controller.
This firewall rule will allow the Grafana server to query the Active directory database.
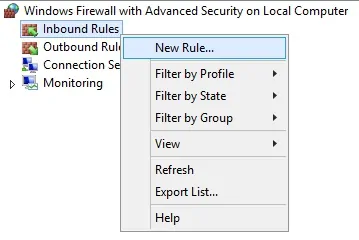
On the domain controller, open the application named Windows Firewall with Advanced Security
Create a new Inbound firewall rule.
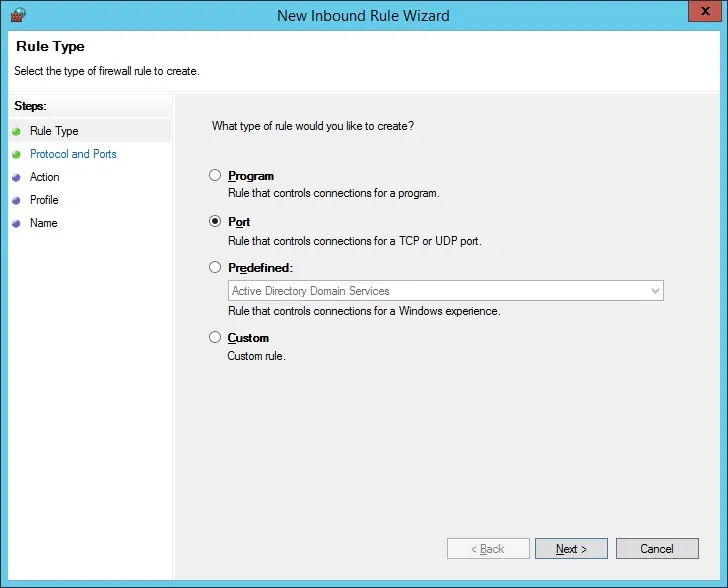
Select the PORT option.
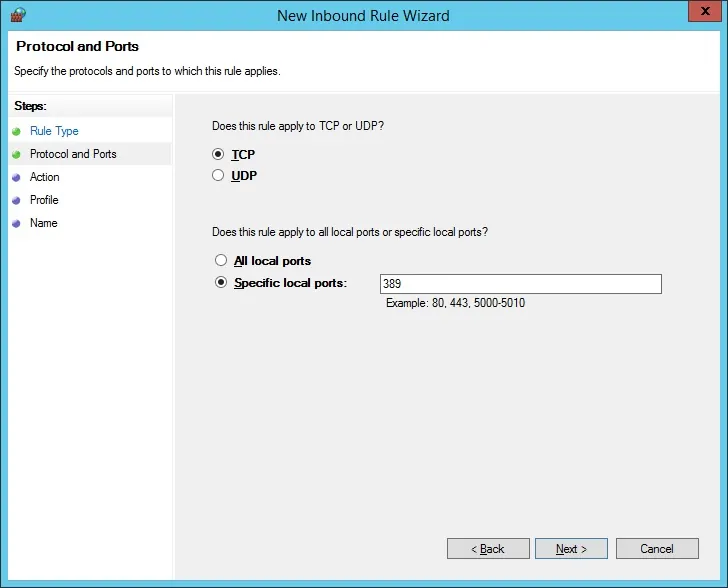
Select the TCP option.
Select the Specific local ports option.
Enter the TCP port 389.
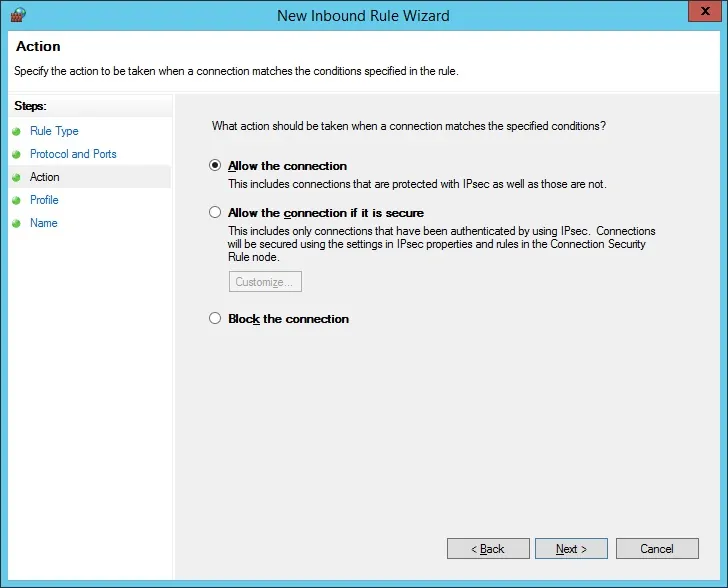
Select the Allow the connection option.
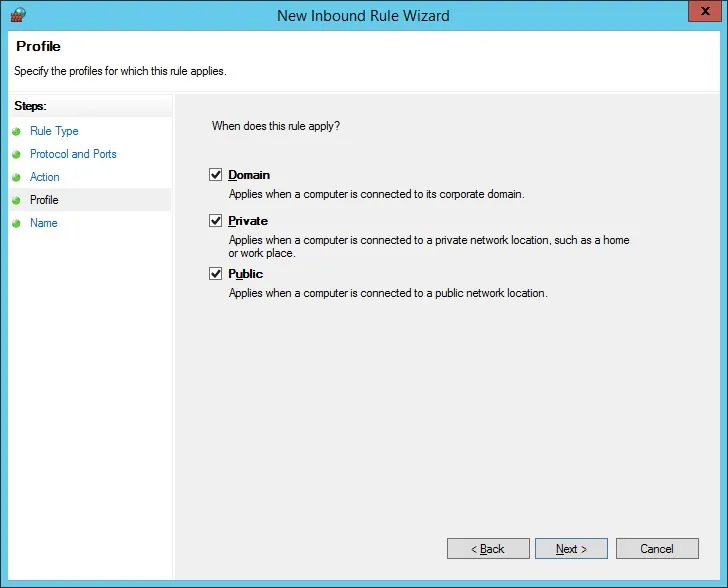
Check the DOMAIN option.
Check the PRIVATE option.
Check the PUBLIC option.
Enter a description to the firewall rule.
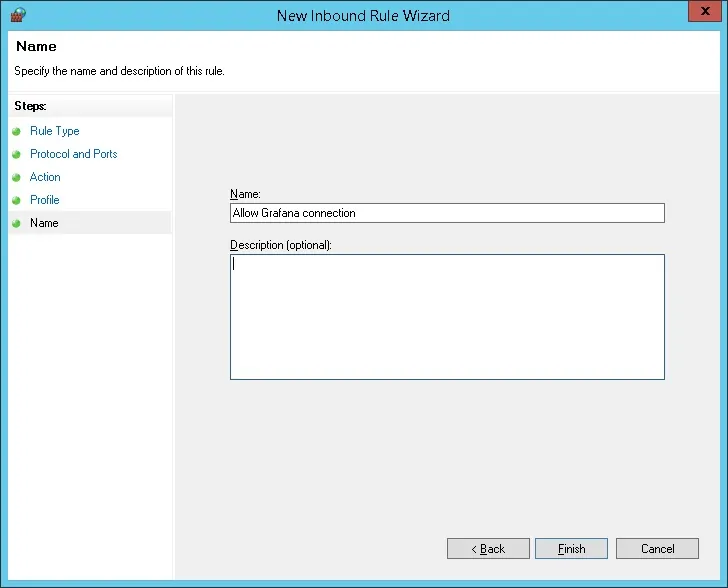
Congratulations, you have created the required firewall rule.
This rule will allow Grafana to query the Active directory database.
Tutorial - Windows Domain Account Creation
Next, we need to create at least 2 accounts on the Active directory database.
The ADMIN account will be used to login on the Grafana web interface.
The GRAFANA account will be used to query the Active Directory database.
On the domain controller, open the application named: Active Directory Users and Computers
Create a new account inside the Users container.
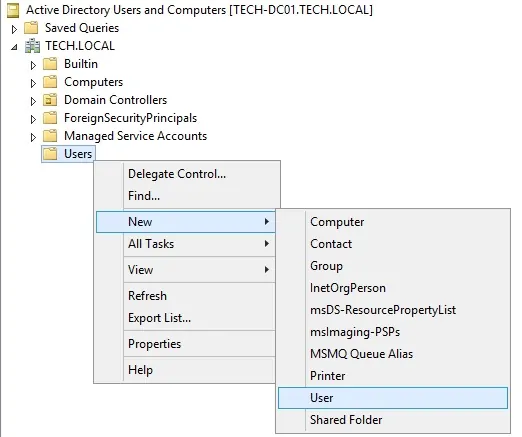
Create a new account named: admin
Password configured to the Admin user: 123qwe..
This account will be used to authenticate as admin on the Grafana web interface.

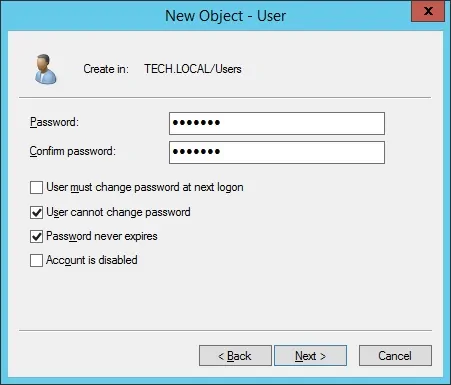
Create a new account named: grafana
Password configured to the grafana user: kamisama123@
This account will be used to query the passwords stored on the Active Directory database.
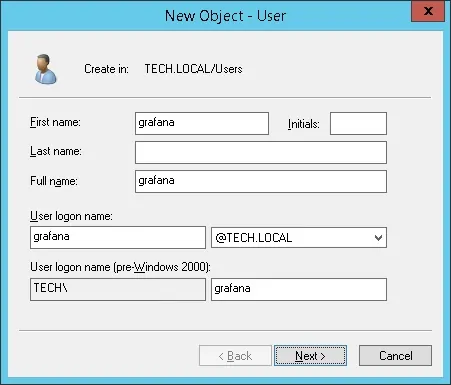
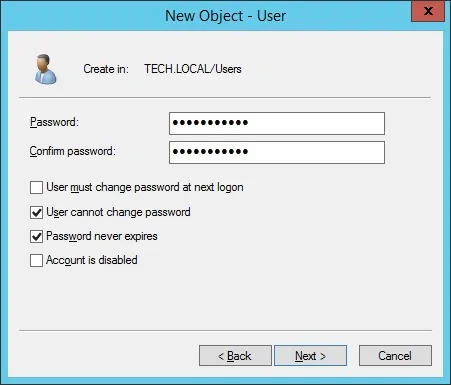
Congratulations, you have created the required Active Directory accounts.
Tutorial - Windows Domain Group Creation
Next, we need to create at least 3 groups on the Active directory database.
On the domain controller, open the application named: Active Directory Users and Computers
Create a new group inside the Users container.
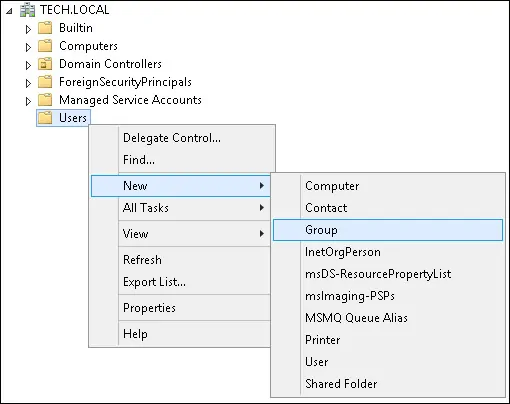
Create a new group named: grafana-admin
Members of this group will have the Admin permission on the Grafana web interface.

Important! Add the admin user as a member of the grafana-admin group.
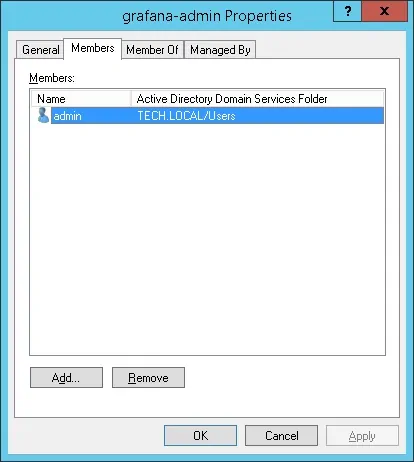
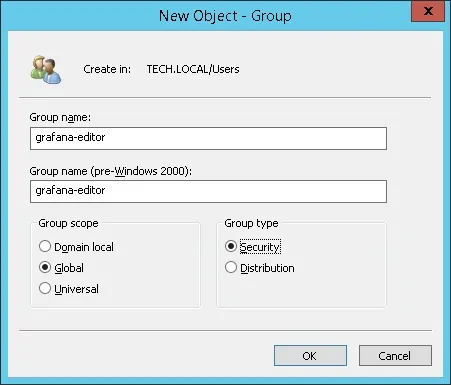
Create a new group named: grafana-editor
Members of this group will have the Editor permission on the Grafana web interface.
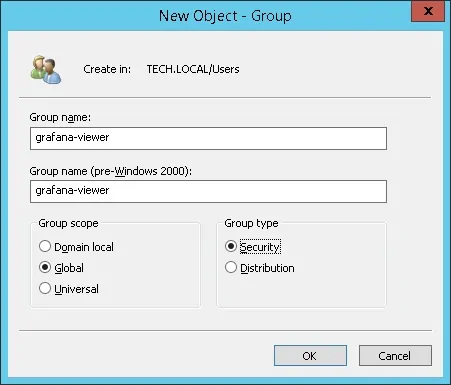
Create a new group named: grafana-viewer
Members of this group will have the Viewer permission on the Grafana web interface.
Congratulations, you have created the required Active Directory groups.
Tutorial - Grafana LDAP Authentication on Active Directory
Now, we need to configure the Grafana server to authenticate on the active directory database.
Locate and edit the ldap.toml file.
# locate ldap.toml
# vi /etc/grafana/ldap.toml
Here is the original ldap.toml configuration file installed by the Grafana Package.
Here is the new file with our configuration.
You need to change the IP address to your domain controller IP.
You need to change the domain information to reflect your Network environment.
Locate and edit the grafana.ini file
# locate grafana.ini
# vi /etc/grafana/grafana.ini
Uncomment and enable the Grafana LDAP authentication section.
Here is the original LDAP authentication section.
Here is the new LDAP authentication section.
Restart the Grafana service.
# /etc/init.d/grafana-server restart
Now, you are able to test the Grafana LDAP Active directory authentication.
Grafana Dashboard Login
Open your browser and enter the IP address of your server plus :3000.
In our example, the following URL was entered in the Browser:
• http://34.216.84.149:3000
The Grafana web interface should be presented.

On the login screen, use the Admin user and the password from the Active Directory database.
• Username: admin
• Password: Enter the Active directory password.
After a successful login, the Grafana dashboard will be displayed.

Congratulations! You have configured the Grafana authentication on Active Directory using LDAP.
