Would you like to learn how to use Zabbix ad-hoc graphs? In this tutorial, we are going to show you how to use Zabbix ad-hoc graphs using real life examples.
• Ubuntu 19.04
• Zabbix 4.2.6
Zabbix ad-hoc graphs offer a way to compare data collected by 2 or more items from multiple hosts.
Zabbix ad-hoc allows you to create a comparison graph for multiple items with little effort.
Hardware List:
The following section presents the list of equipment used to create this Zabbix tutorial.
Every piece of hardware listed above can be found at Amazon website.
Zabbix Playlist:
On this page, we offer quick access to a list of videos related to Zabbix installation.
Don't forget to subscribe to our youtube channel named FKIT.
Zabbix Related Tutorial:
On this page, we offer quick access to a list of tutorials related to Zabbix installation.
Zabbix - Create an Ad-hoc graph
Open your browser and enter the IP address of your web server plus /zabbix.
In our example, the following URL was entered in the Browser:
• http://35.162.85.57/zabbix
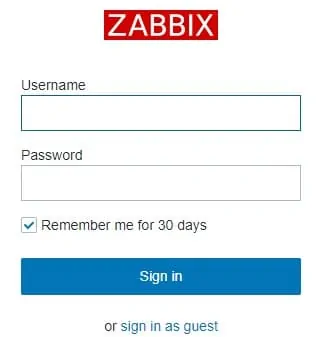
On the login screen, use the default username and default password.
• Default Username: Admin
• Default Password: zabbix

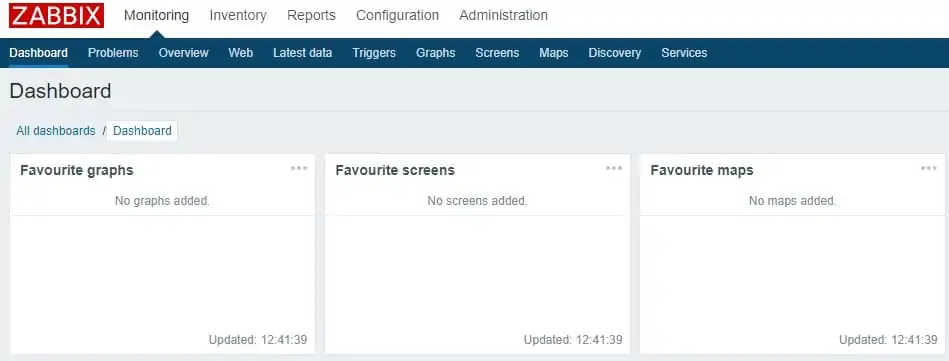
After a successful login, you will be sent to the Zabbix Dashboard.

On the dashboard screen, access the Monitoring menu and select the Latest data option.

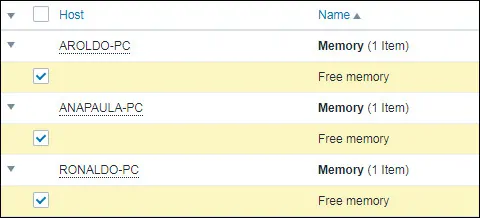
Use the filter option available on the top of the screen to select 2 or more hosts and click on the Apply button.

In our example, we are going to use Zabbix ad-hoc graphs to perform a comparison between the free memory available in the following Windows desktops: AROLDO-PC, ANAPULA-PC and RONALDO-PC.

Select the checkboxes from the items that you wish to compare and click on the Display graph button.
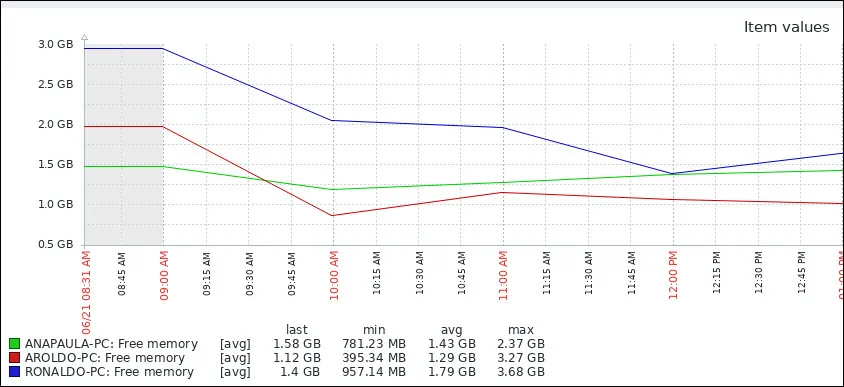
You will be presented to an Ad-hoc graph comparing the free memory available using lines.

Congratulations! You have learned how to use Zabbix Ad-hoc graphs.

Leave A Comment
You must be logged in to post a comment.