Would you like to learn how to use Zabbix to monitor a UDP port? In this tutorial, we are going to show you how to configure Zabbix UDP monitor in 5 minutes or less.
• Zabbix version: 3.4.12
Equipment list
Here you can find the list of equipment used to create this tutorial.
This link will also show the software list used to create this tutorial.
Zabbix Playlist:
On this page, we offer quick access to a list of videos related to Zabbix installation.
Don't forget to subscribe to our youtube channel named FKIT.
Zabbix Related Tutorial:
On this page, we offer quick access to a list of tutorials related to Zabbix installation.
Tutorial Zabbix - Monitoring a UDP Port
Now, we need to access the Zabbix server dashboard and add a new Host.
Open your browser and enter the IP address of your web server plus /zabbix.
In our example, the following URL was entered in the Browser:
• http://35.162.85.57/zabbix
On the login screen, use the default username and default password.
• Default Username: Admin
• Default Password: zabbix
After a successful login, you will be sent to the Zabbix Dashboard.
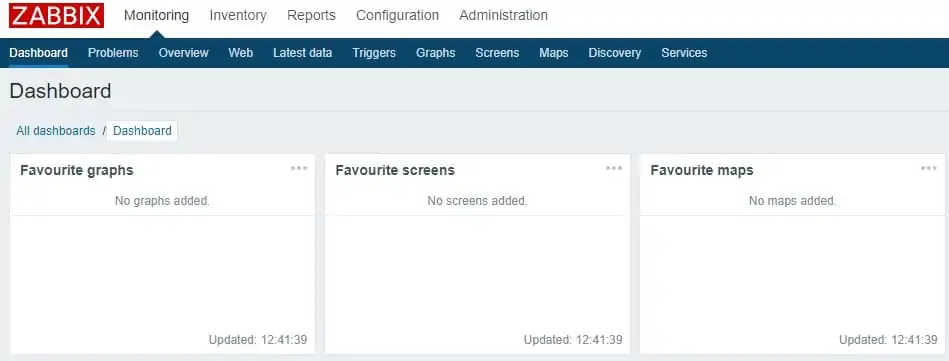
On the dashboard screen, access the Configuration menu and select the Host option.

On the top right of the screen, click on the Create host button.
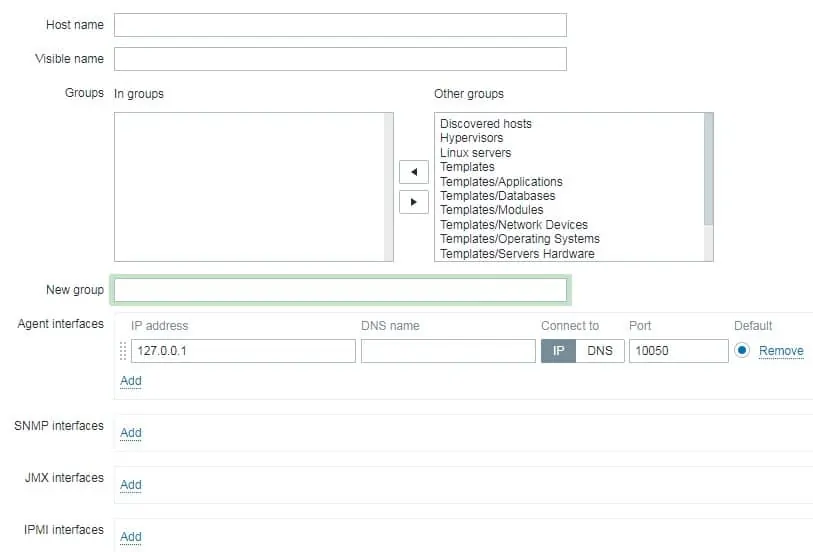
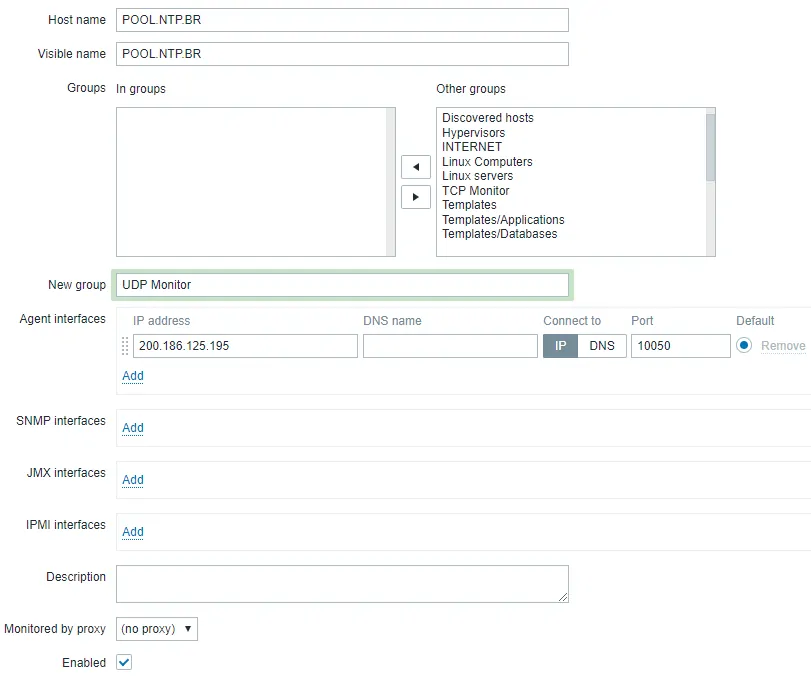
On the Host configuration screen, you will have to enter the following information:
• Host Name - Enter a Hostname to monitor.
• Visible Hostname - Repeat the hostname.
• New group - Enter a name to identify a group of similar devices.
• Agent Interface - Enter the IP address of the Hostname.
Here is the original image, before our configuration.
Here is the new image with our configuration.
Click on the Add button to include this host on the Zabbix database.
On the dashboard screen, access the Configuration menu and select the Host option.

Locate and click on the hostname that you created before.
In our example, we selected the hostname: POOL.NTP.BR
On the Host properties screen, access the Applications tab.
On the top right part of the screen, click on the Create application button.
On the Host applications screen, create a new application named TCP Status.

After finishing the Application creation, access the Items tab.
On the top right part of the screen, click on the Create item button.
On the Item creation screen, you need to configure the following items:
• Name: Enter an identification to the UDP port.
• Type: Simple check
• Key: net.udp.service[ntp]
• Type of Information: Numeric (Unsigned)
• Update interval: 60 Seconds
• Show value: Service State
• Application: UDP Status
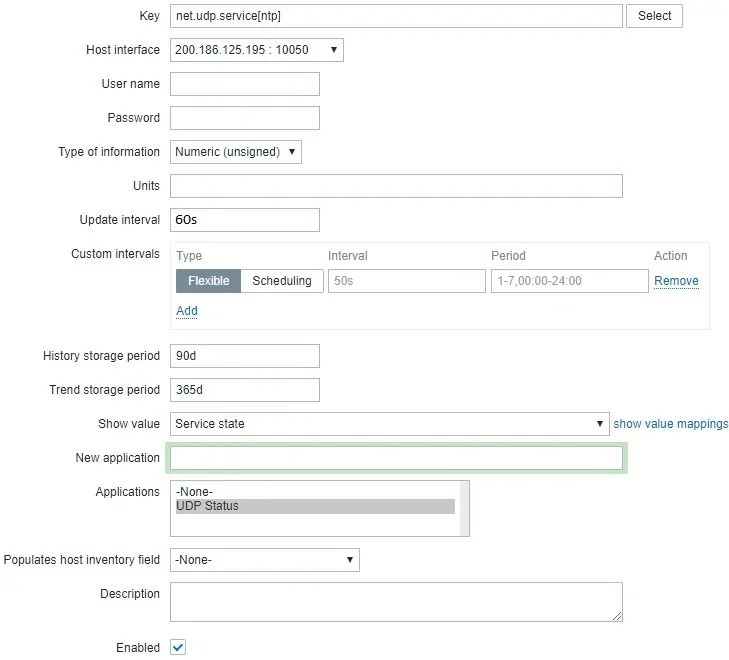
Click on the Add button and finish the Item creation.
Wait 5 minutes.
In order to test your configuration, access the Monitoring menu and click on the Latest data option.

Use the filter configuration to select the desired hostname.
In our example, we selected the hostname POOL.NTP.BR
Click on the Apply button.

You should be able to see the results of your TCP port monitoring using Zabbix.

In our example, we were able to monitor the status of the NTP UDP port 123 of a host.
Congratulations! You have configured the Zabbix server to monitor an UDP Port status.
To monitor the UDP Port performance, create a new item using the following example.
In our example, we are monitoring the performance of the UDP port 123 of a host.
On the top right part of the screen, click on the Create item button.
On the Item creation screen, you need to configure the following items:
• Name: Enter an identification.
• Type: Simple check
• Key: net.tcp.service.perf[http,,80]
• Type of Information: Numeric (Float)
• Units: s
• Update interval: 60 Seconds
• Show value: As is
• Application: TCP Status
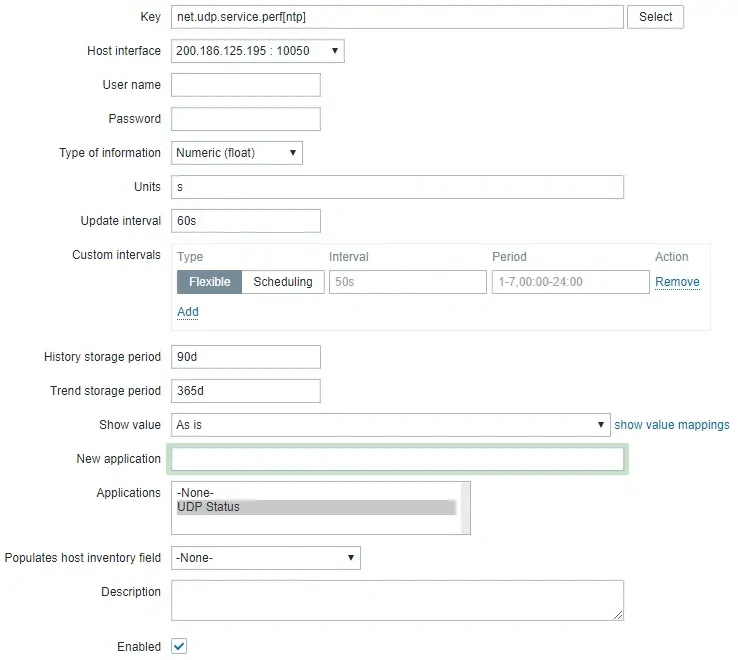
Keep in mind that only a limited group of UDP ports may be monitored using Zabbix native UDP monitor features.
If you want to monitor UDP ports that are not supported by Zabbix, you will have to create a shell script to do the job and integrate the shell script to Zabbix.
Take a look at our Zabbix tutorial list to learn how to create custom monitor scripts on Zabbix
