Would you like to learn how to monitor an IIS server using Zabbix? In this tutorial, we are going to show you how to use Zabbix to monitor an IIS web server.
• Ubuntu 18.04
• Ubuntu 19.04
• Ubuntu 20.04
• Windows 2012 R2
• Zabbix 5.0.1
• IIS 8.5
In our example, the Zabbix server IP address is 192.168.100.9.
In our example, the IIS server IP address is 192.168.100.10.
Zabbix Playlist:
On this page, we offer quick access to a list of videos related to Zabbix installation.
Don't forget to subscribe to our youtube channel named FKIT.
Zabbix Related Tutorial:
On this page, we offer quick access to a list of tutorials related to Zabbix installation.
Install the Zabbix Agent on the IIS Server
• IP - 192.168.100.10
• Operational System - Windows 2012 R2
• Hostname - IIS
Access the Zabbix website and download the Zabbix installation package.

In our example, we download the Zabbix file named: zabbix_agent-5.0.1-windows-amd64-openssl.msi
Start the Zabbix agent installation on the IIS server.
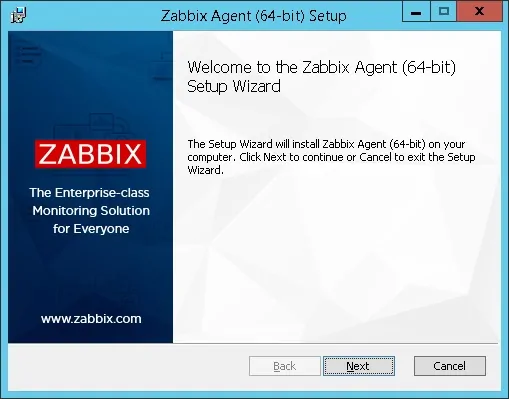
Perform the following configuration on the Zabbix agent:
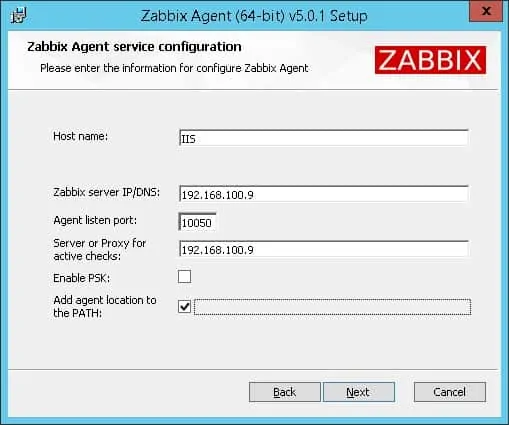
In our example, the Zabbix agent is configured to allow connections from the Zabbix server 192.168.100.9.
The server with the IP address 192.168.100.9 is allowed to request and receive information from the agent.
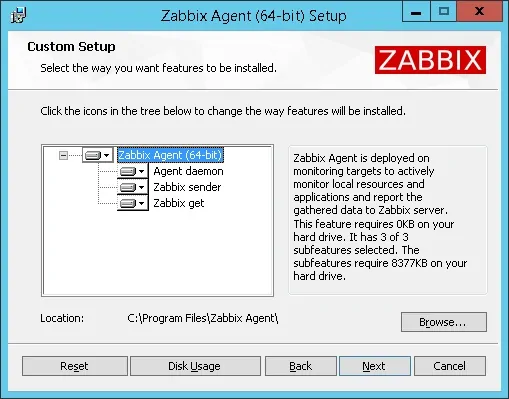
Click on the Next button until the installation is finished.
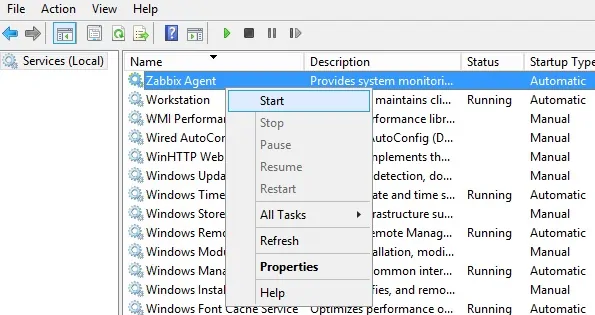
Open the Windows service management screen.
Restart the Zabbix agent service.
You have finished the Zabbix agent installation.
Now, you can use the Zabbix dashboard to monitor the IIS service installed on this computer.
Zabbix - Monitoring the IIS service
Access the Zabbix server dashboard and add the Linux computer running the IIS service as a Host.
Open your browser and enter the IP address of your web server plus /zabbix.
In our example, the following URL was entered in the Browser:
• http://192.168.100.9/zabbix
On the login screen, use the default username and default password.
• Default Username: Admin
• Default Password: zabbix
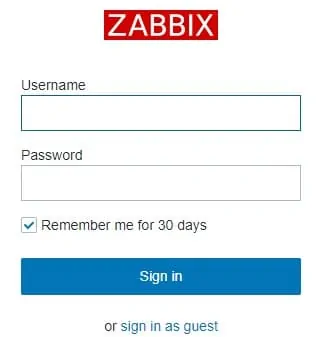
After a successful login, you will be sent to the Zabbix Dashboard.

On the dashboard screen, access the Configuration menu and select the Templates option.
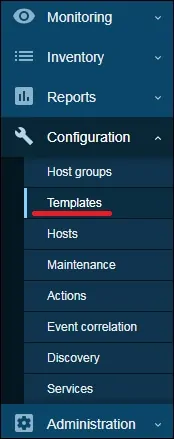
On the top right of the screen, click on the Import button.
Access the Zabbix integrations website and download the IIS monitoring template.
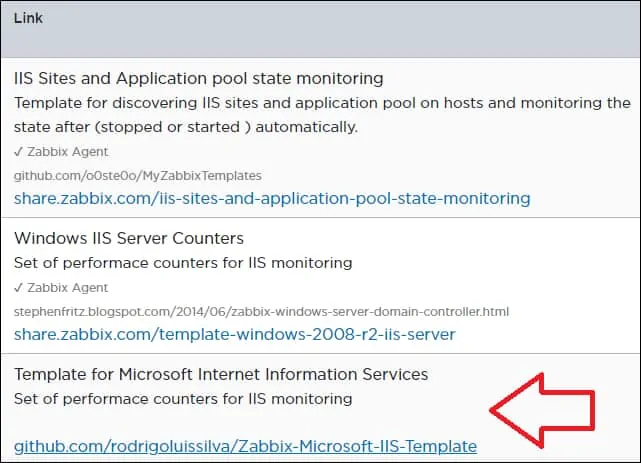
The IIS monitoring template is an XML file named: Template Microsoft IIS.
Import the IIS monitoring template.
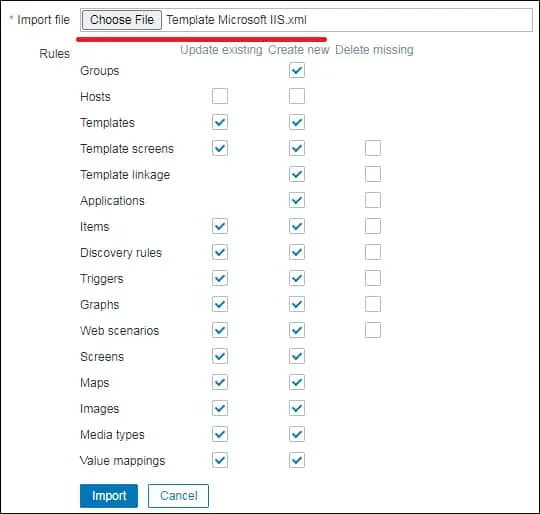
On the dashboard screen, access the Configuration menu and select the Host option.
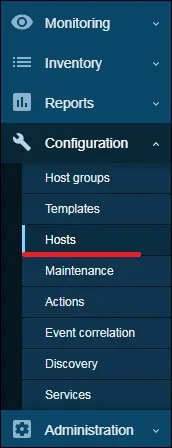
On the top right of the screen, click on the Create host button.
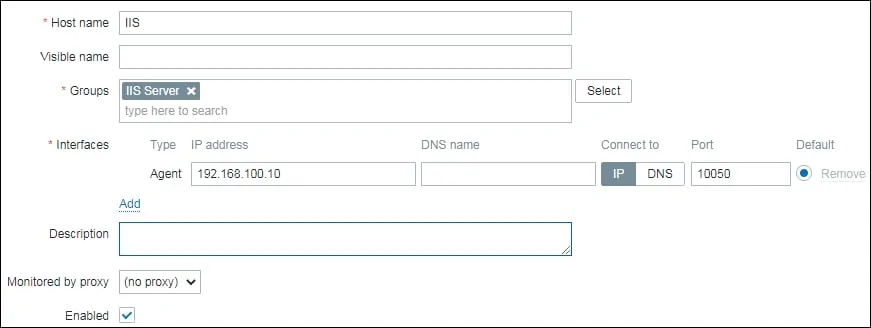
Enter the following information:
• Host Name - Enter a Hostname to identify the IIS server.
• Visible Hostname - Repeat the hostname.
• Group - Select the name of a group to identify similar devices.
• Interfaces - Enter the IP address of the IIS server.
Here is the new image with our configuration.
Next, we need to associate the host to a monitoring template.
Access the Templates tab on the top of the screen.
Click on the Select button and locate the template named: TEMPLATE MICROSOFT IIS.

Click on the Add button.
After a few minutes, you will be able to see the initial result on the Zabbix Dashboard.
In order to test your configuration, access the Monitoring menu, and click on the option named: Latest data.
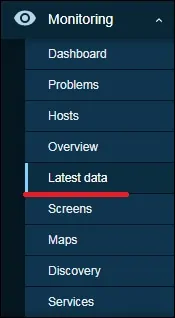
Find your server and click on the Apply button.
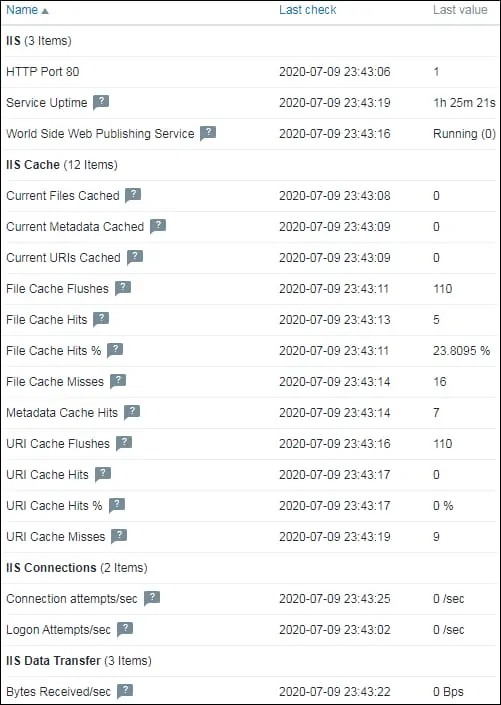
This template also offers Graphics and screens.
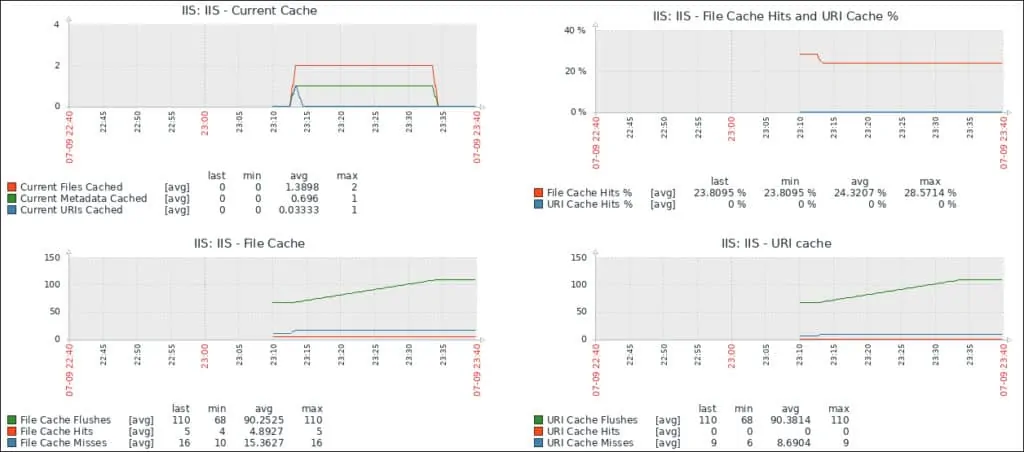
Congratulations! You have configured the Zabbix server to monitor an IIS server.
