Would you like to learn how to do a Zabbix agent installation on Windows? In this tutorial, we are going to show you how to install and configure the Zabbix agent software on a computer running Windows.
• Zabbix version: 3.4.12
• Windows version: 2012 R2
Hardware List:
The following section presents the list of equipment used to create this Zabbix tutorial.
Every piece of hardware listed above can be found at Amazon website.
Zabbix Playlist:
On this page, we offer quick access to a list of videos related to Zabbix installation.
Don't forget to subscribe to our youtube channel named FKIT.
Zabbix Related Tutorial:
On this page, we offer quick access to a list of tutorials related to Zabbix installation.
Tutorial - Zabbix Agent Installation on Windows
First, we need to install the Zabbix agent on Windows.
Access the Zabbix website and download the Zabbix installation package.

In our example, we download the Zabbix file: zabbix-3.4.12.tar.gz
Open the Windows Explorer application, navigate to the root of drive C and create a new directory.
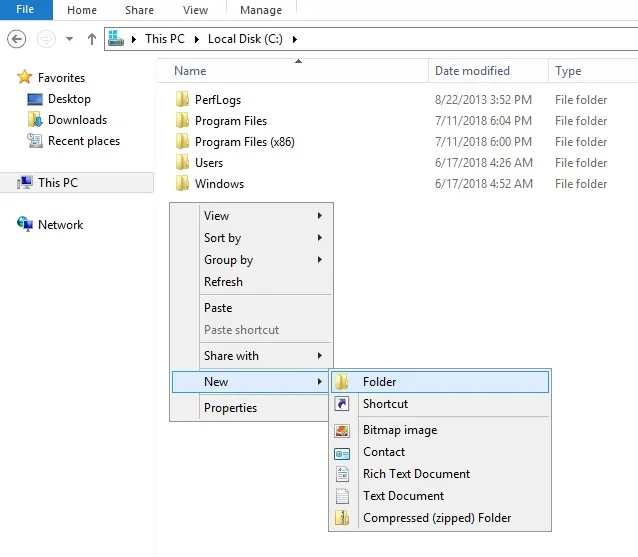
The new directory name should be: zabbix
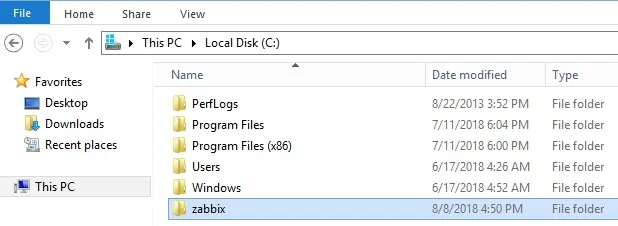
The Zabbix installation package usually is compacted using a TAR.GZ file extension.
Today, Windows is not able to open TAR.GZ extensions file.
Download and install 7ZIP or WINRAR to enable the Windows operating system to use TAR.GZ files.
Use a program like 7ZIP or WINRAR to extract the Zabbix installation package content.
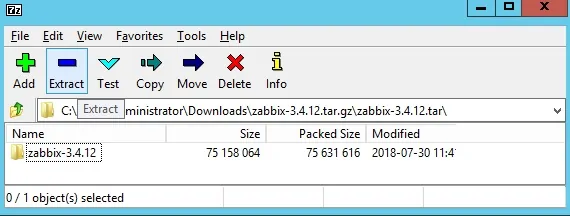
In our example, we used the 7ZIP software.
Copy the content of the following Zabbix installation package: zabbix-3.4.12\bin\win64
Paste the content of the inside the folder that we created before: C:\zabbix
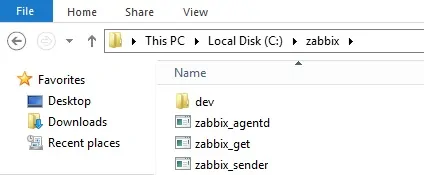
Copy file zabbix_agentd.win.conf from the following Zabbix installation package folder: zabbix-3.4.12\conf
Paste the file zabbix_agentd.win.conf inside the folder that we created before: C:\zabbix
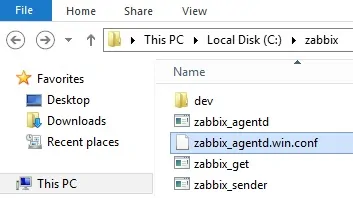
Open the WORDPAD application and edit the zabbix_agentd.win.conf configuration file.
The file zabbix_agentd.win.conf is locate inside the C:\Zabbix folder.
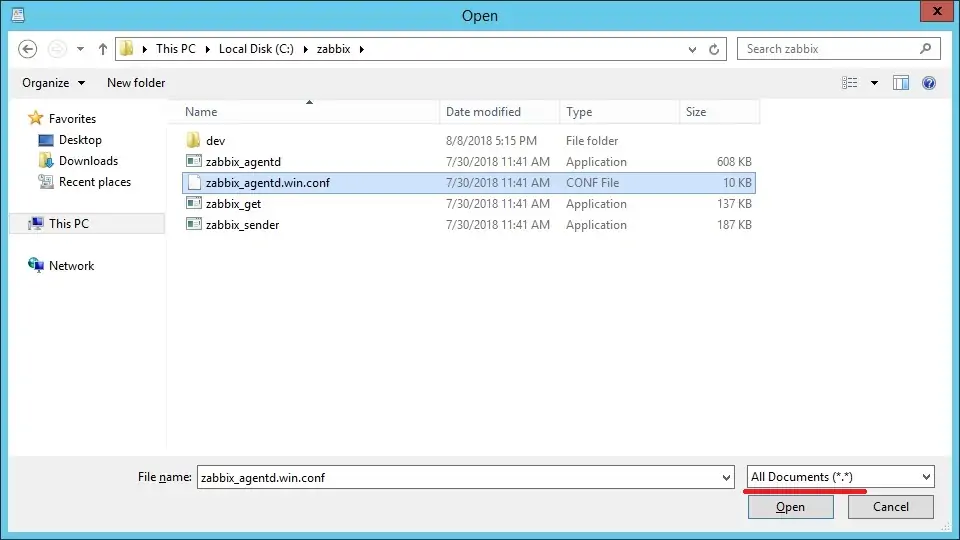
Delete all the content of the configuration file and enter the following directives:
Server=127.0.0.1,200.200.200.200
ServerActive=200.200.200.200
Logfile=C:\zabbix\zabbix_agent.log
Save the configuration file and exit the WORDPAD application.
In our example, the Zabbix agent is configured to allow the connection of the Zabbix server 200.200.200.200.
The server with the IP address 200.200.200.200 is allowed to request and receive information from the agent.
The Localhost, 127.0.0.1, is allowed to request and receive information from the agent.
After finishing the configuration, open a DOS elevated command prompt.
Enter the following command to install the Zabbix agent service on Windows.
c:\zabbix\zabbix_agentd.exe --config c:\zabbix\zabbix_agentd.win.conf --install
If everything was done correctly, you should see the following messages
zabbix_agentd.exe [4508]: service [Zabbix Agent] installed successfully
zabbix_agentd.exe [4508]: event source [Zabbix Agent] installed successfully
The Zabbix agent was installed on your computer but we need to start the service manually.
You only need to start the service manually the first time after the installation.
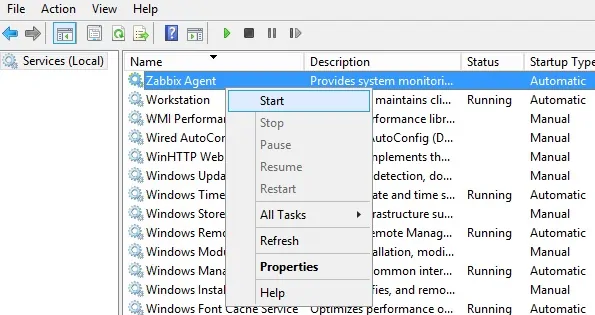
Open the Windows service management screen and start the Zabbix agent service.
Open the zabbix_agent.log file to verify the Zabbix agent log file.
If the Zabbix agent was started successfully, you should see a message similar to this.
4964:20180808:190920.442 Starting Zabbix Agent [WINDOWS-SERVER-01]. Zabbix 3.4.12 (revision 83216).
4964:20180808:190920.442 **** Enabled features ****
4964:20180808:190920.442 IPv6 support: YES
4964:20180808:190920.442 TLS support: NO
4964:20180808:190920.442 **************************
4964:20180808:190920.442 using configuration file: c:\zabbix\zabbix_agentd.win.conf
4964:20180808:190920.442 agent #0 started [main process]
4764:20180808:190920.442 agent #2 started [listener #1]
4856:20180808:190920.442 agent #1 started [collector]
4340:20180808:190920.442 agent #3 started [listener #2]
4400:20180808:190920.442 agent #5 started [active checks #1]
5016:20180808:190920.442 agent #4 started [listener #3]
Congratulations! you have installed the Zabbix agent on a computer running Windows
Keep in mind that your Windows firewall application needs to accept connections from the Zabbix server.
The Windows firewall should accept network packets on TCP port: 10050
You can now use the Zabbix server dashboard to add this computer to the network monitoring service.
Tutorial - Zabbix Monitor Windows
Now, we need to access the Zabbix server dashboard and add the Windows computer as a Host.
Open your browser and enter the IP address of your web server plus /zabbix.
In our example, the following URL was entered in the Browser:
• http://35.162.85.57/zabbix
On the login screen, use the default username and default password.
• Default Username: Admin
• Default Password: zabbix
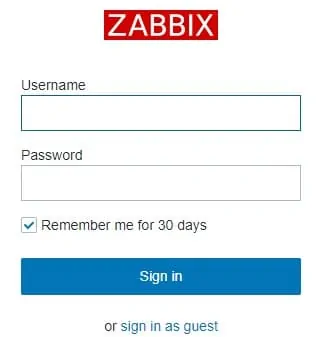
After a successful login, you will be sent to the Zabbix Dashboard.
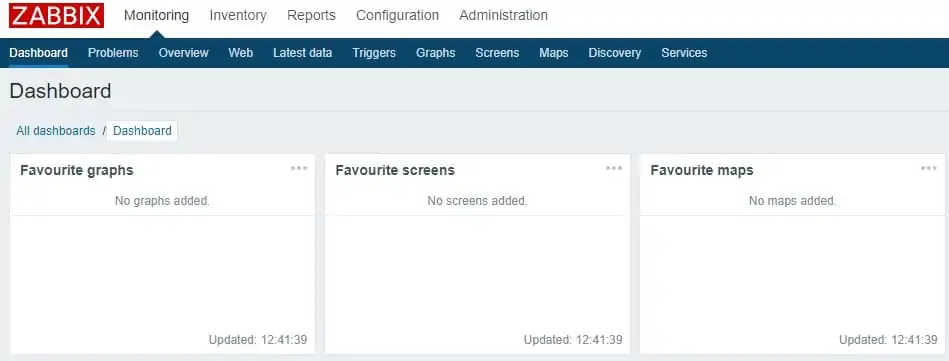
On the dashboard screen, access the Configuration menu and select the Host option.

On the top right of the screen, click on the Create host button.
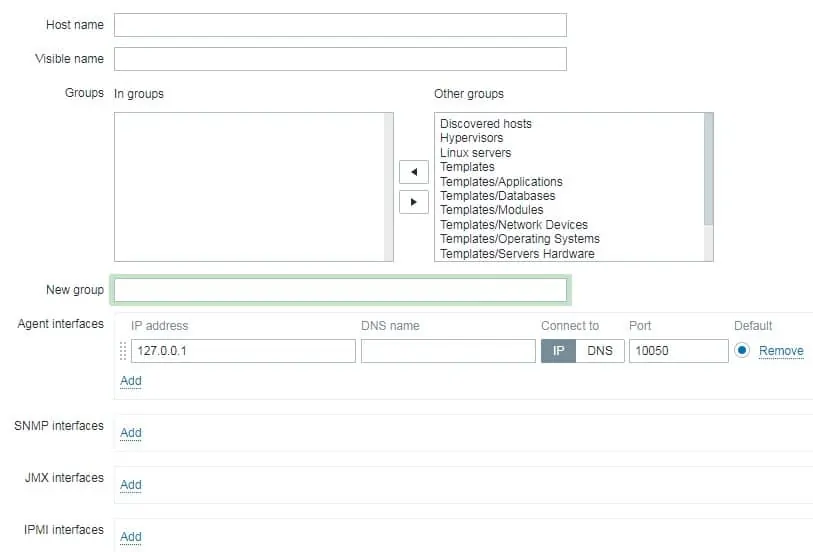
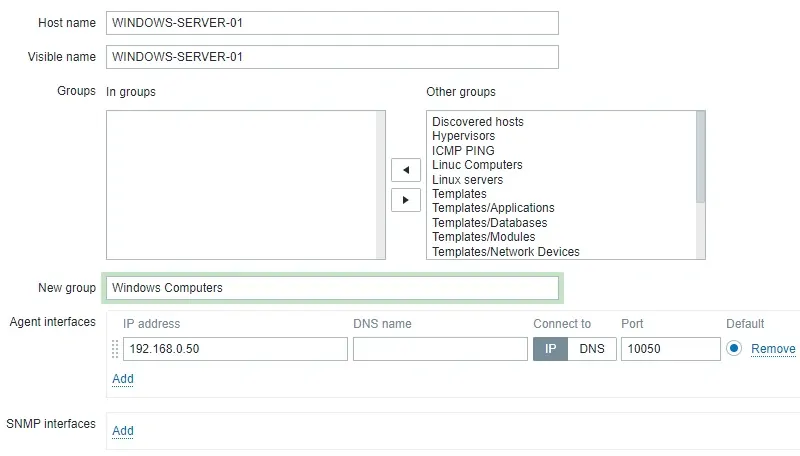
On the Host configuration screen, you will have to enter the following information:
• Host Name - Enter a Hostname to identify the Windows server.
• Visible Hostname - Repeat the hostname.
• New group - Enter a name to identify a group of similar devices.
• Agent Interface - Enter the IP address of the Windows server.
Here is the original image, before our configuration.
Here is the new image with our configuration.
Next, we need to associate the host with a specific network monitor template.
By default, Zabbix comes with a large variety of monitoring templates.
Access the Templates tab on the top of the screen.
Click on the Select button and locate the template named: TEMPLATE OS Windows

Click on the Add button (1).
Click on the Add button (2).
After a few minutes, you will be able to see the initial result on the Zabbix Dashboard.
The final result will take at least one hour.
By default, Zabbix will wait 1 hour to discover the number of interfaces available on the Windows computer.
By default, Zabbix will wait 1 hour before collect information from the network interfaces.
In order to test your configuration, access the Monitoring menu and click on the Graphs option.

On the top right of the screen, select the group named ALL.
Select your Windows computer host name.
Select the graph named: CPU UTILIZATION
You should be able to see the graphic of CPU utilization.
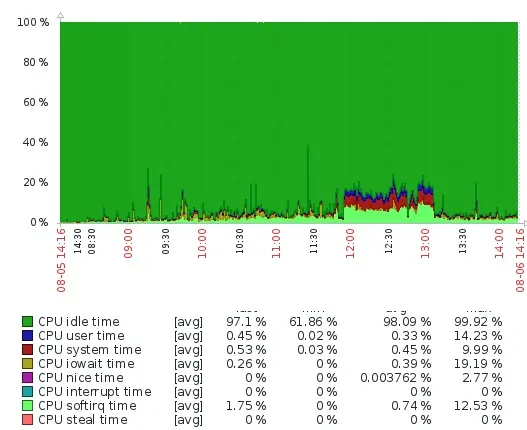
Congratulations! You have configured the Zabbix server to monitor a Windows computer.
