Would you like to learn how to do send System metrics from a Linux computer to an ElasticSearch server? In this tutorial, we are going to show you how to install Metricbeat on a Linux computer and send the System metrics to an ElasticSearch server on a computer running Ubuntu Linux.
• Ubuntu 18
• Ubuntu 19
• ElasticSearch 7.6.2
• Kibana 7.6.2
• Metricbeat 7.6.2
In our example, The ElastiSearch server IP address is 192.168.100.7.
ElasticSearch Related Tutorial:
On this page, we offer quick access to a list of tutorials related to ElasticSearch installation.
Tutorial Metricbeat - Installation on Ubuntu Linux
Set a hostname using the command named hostnamectl.
Reboot the computer.
Download and install the Metricbeat package.
Enable the Metricbeat module named System.
Edit the Metricbeat configuration file named metricbeat.yml.
Here is the original file, before our configuration.
Here is the file with our configuration.
In our example, we configured the Metricbeat service to send data to the ElasticSearch server 192.168.100.7.
In our example, we configured the Metricbeat service to connect to the Kibana server 192.168.100.7.
Use the following command to create the Metricbeat dashboards on the Kibana server.
Start the Metricbeat service.
Configure the Metricbeat service to start during boot time.
Congratulations! You have finished the Metricbeat installation on Ubuntu Linux.
Kibana - Accessing the Metricbeat Dashboard
Open your browser and enter the IP address of your Kibana server plus :5601.
In our example, the following URL was entered in the Browser:
• http://192.168.100.7:5601
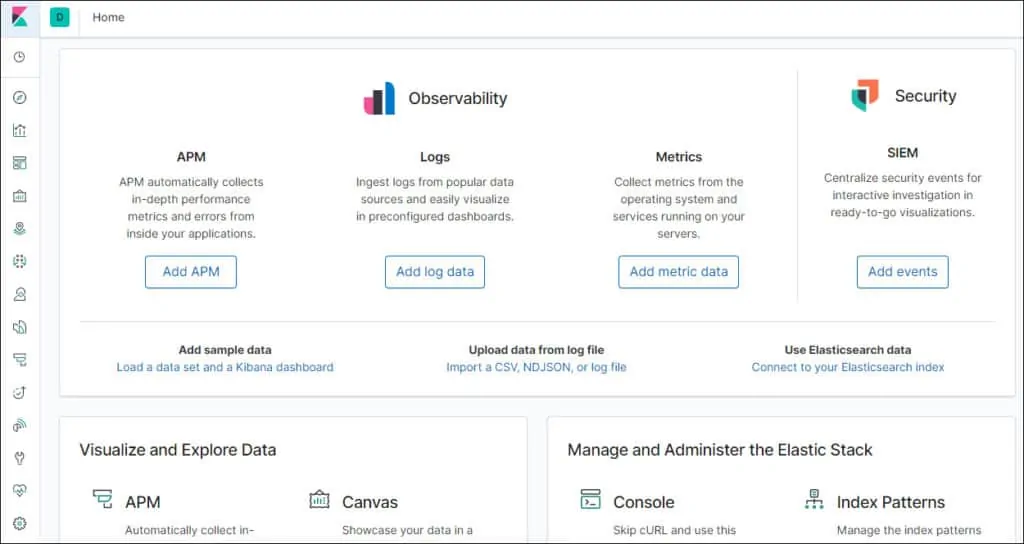
The Kibana web interface should be presented

On the Visualize and Explore Data area, select the Dashboard option.

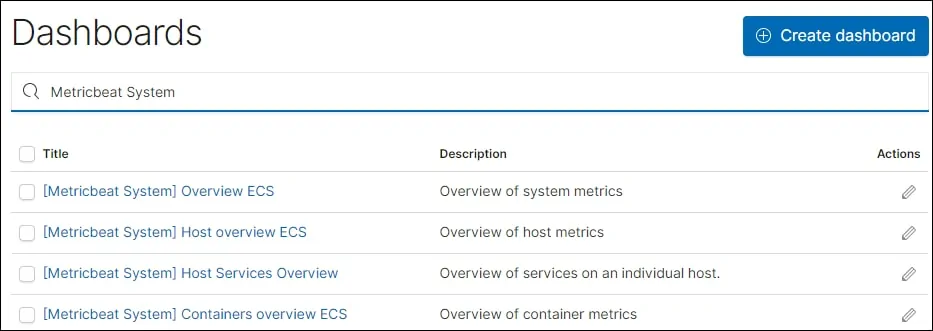
Search for dashboards named: Metricbeat System

Select the desired Metricbeat dashboard.

Congratulations! You are able to access the Metricbeat information on the Kibana server.
