Would you like to learn how to monitor SNMP devices using Grafana on Ubuntu Linux? In this tutorial, we are going to show you how to install Grafana on Ubuntu Linux and how install InfluxDB and Telegraf to collect and store SNMP information from other devices from your network.
How does it Work?
We are going to use Telegraf agent to collect SNMP information remotely from a device.
All information collected by Telegraf will be inserted in the INfluxDB database.
Grafana will connect to the InfluxDB database, get the required information and create a dashboard.
What is Grafana?
Grafana is an open-source platform for data monitoring, analysis, and visualization that comes with a web server that allows it to be accessed from anywhere.
On the Web interface, users are able to create Grafana dashboards with panels to represent metrics over time.
Grafana Tutorial:
On this page, we offer quick access to a list of Grafana tutorials.
Tutorial - Grafana Installation on Ubuntu Linux
On the Linux console, use the following commands to install the MySQL database service.
Use the following command to access the MySQL command-line.
Use the following SQL command to create a database named grafana.
Use the following SQL command to create a database user named grafana.
Give the SQL user named grafana permission over the database named grafana.
On the Linux console, use the following commands to configure the Grafana APT repository.
Use the following command to install Grafana.
Edit the Grafana configuration file grafana.ini.
Perform the following configuration under the [Database] section.
Keep in mind that you need to change the MySQL username and password to reflect your environment.
Use the following command to start the Grafana service.
The Grafana service will start listening on TCP port 3000.
Configure the Grafana service to start automatically during boot.
Verify the status of the Grafana service.
Here is an example of the Grafana service status.
Open your browser and enter the IP address of your server plus :3000.
In our example, the following URL was entered in the Browser:
• http://34.216.84.149:3000
The Grafana web interface should be presented.

On the prompt screen, enter the Grafana Default Password login information.
• Username: admin
• Password: admin
The system will ask you to change the Grafana default password.

After a successful login using the new password, the Grafana dashboard will be displayed.

Congratulations! You have installed Grafana on Ubuntu Linux.
Tutorial - InfluxDB Installation on Ubuntu Linux
Download and install the InfluxDB package on Ubuntu Linux.
Configure the InfluxDB service to start automatically during boot.
Verify the status of the influxDB service.
Here is an example of the influxDB service status.
Now, use the following command to connect to the InfluxDB command-line.
Congratulations! You have finished the influxDB installation on Ubuntu Linux.
Tutorial - Telegraf Installation on Ubuntu Linux
Install the required software to enable SNMP monitoring.
Edit the SNMP configuration file named snmp.conf.
Here is the original file, before our configuration.
Here is the new file with our configuration.
You have finished the SNMP client configuration.
Download and install the Telegraf package on Ubuntu Linux.
Configure the Telegraf service to start automatically during boot.
Verify the status of the Telegraf service.
Here is an example of the Telegraf service status.
Congratulations! You have finished the Telegraf installation on Ubuntu Linux.
Use this command if you need to edit the Telegraf configuration file:
Here is the default configuration file from the Telegraf service.
Now, let's create a configuration file to connect the local installed Telegraf agent to a remote SNMP device.
In our example the remote snmp device will be a Linux computer running the SNMP service with the following configurations:
• Ubuntu 18.04
• Device IP address: 172.31.41.29
• Device Hostname: ip-172-31-41-29
• SNMP Comunity name: GokuBlack
Create a telegraf configuration file to enable the SNMP monitoring feature.
Here is the File content:
You need to change the IP address 172.31.41.29:161 and the SNMP community to reflect your environment.
Restart the Telegraf service.
Test your configuration file:
As a test, let's connect to the InfluxDB installed locally.
Access the Telegraf database and verify what is the system monitoring.
As a test, select the last 2 lines of information stored on the SNMP sensor.
Congratulations! Your Telegraf installation is working.
Grafana Monitoring SNMP Device
Now, we need to create a connection between Grafana and the InfluxDB database.
Open your browser and enter the IP address of your Grafana server plus :3000.
In our example, the following URL was entered in the Browser:
• http://34.216.84.149:3000
The Grafana web interface should be presented.
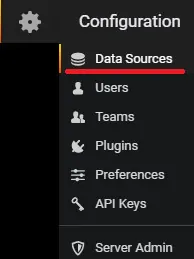
On the Grafana dashboard, access the Configuration menu and select the Data sources option.
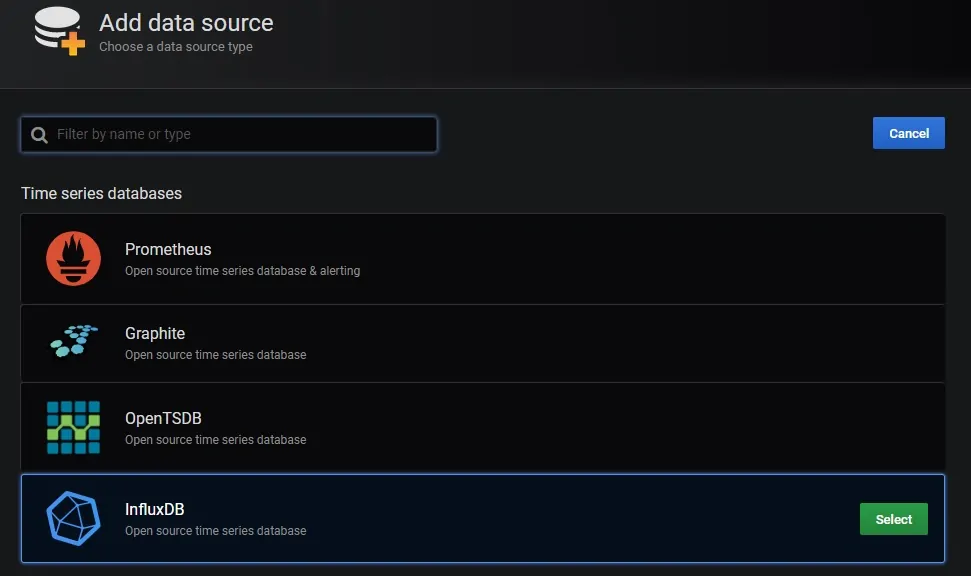
Add the following data source: InfluxDB
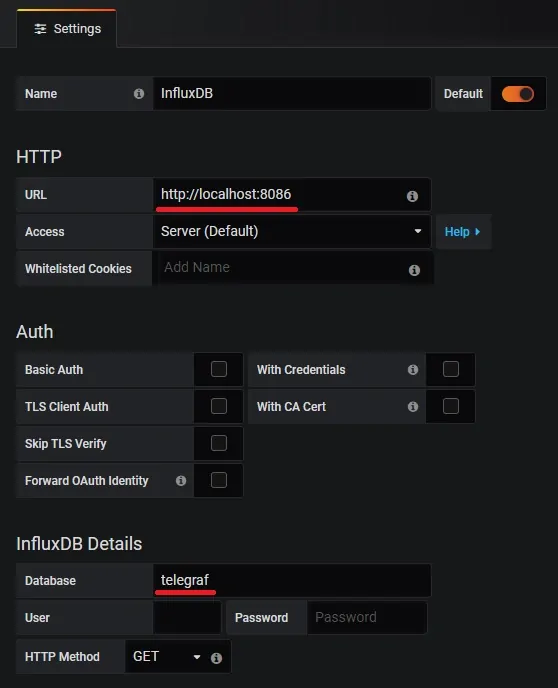
Perform the following data source configuration:
• URL: http://localhost:8086
• DATABASE: telegraf
Click on the Save and Test button.
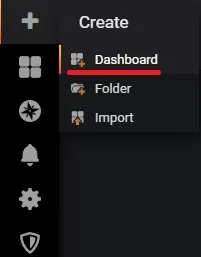
On the Grafana dashboard, access the Create menu and select the Dashboard option.
On this screen, select the Add query option.
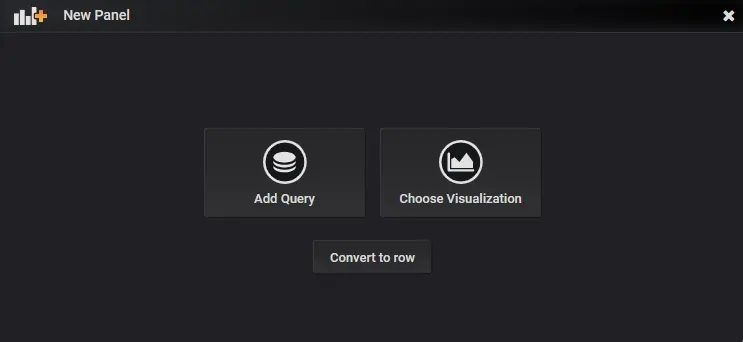
Select InfluxDB as the Query target.
Create a query to monitor your SNMP device.
Here is an image of the query that I created to monitor the network interface eth0 input.
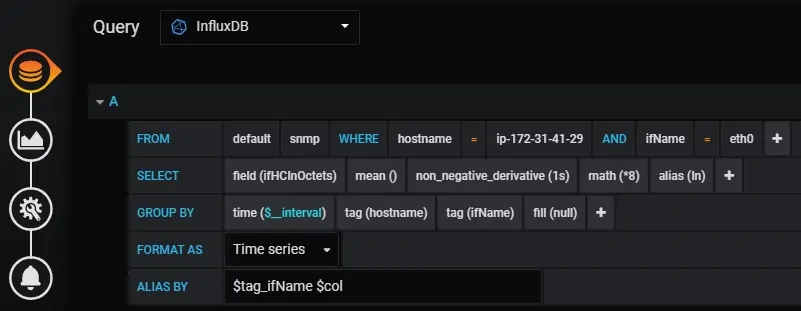
Here is an image of the query that I created to monitor the network interface eth0 output.

Here is the Grafana query used to monitor the eth0 interface input:
Here is the Grafana query used to monitor the eth0 interface output:
Access the Visualization menu and change the Axes unit to: bits/sec
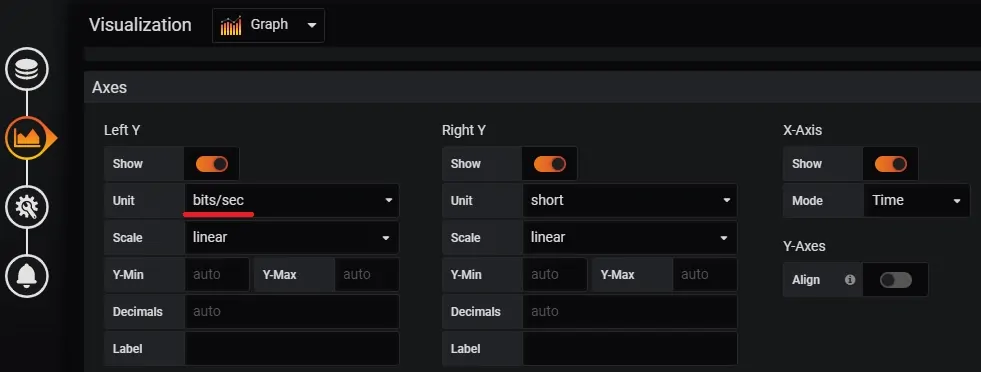
Save your dashboard, go back to the Dashboards home menu.
Select the Dashboard name that you created.
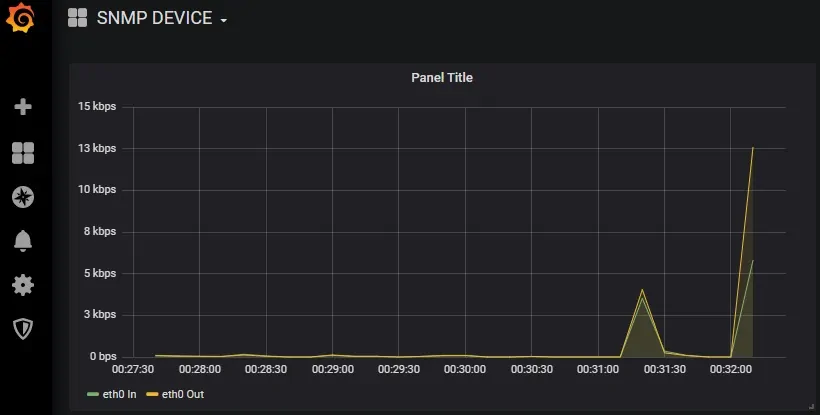
Congratulations! You are now able to use Grafana to monitor snmp devices.
