Would you like to learn how to use the Zabbix Ping monitor feature? In this tutorial, we are going to show you how to configure Zabbix to monitor a Host using ICMP packages.
• Zabbix version: 3.4.12
• Ubuntu Linux version: 18
Zabbix Playlist:
On this page, we offer quick access to a list of videos related to Zabbix installation.
Don't forget to subscribe to our youtube channel named FKIT.
Zabbix Related Tutorial:
On this page, we offer quick access to a list of tutorials related to Zabbix installation.
Tutorial - Enable Zabbix ICMP Ping Monitoring
First, we need to install the FPING package to enable Zabbix to perform ICMP checks.
We also need to take note of the FPING program location.
Use the WHICH command to find out the FPING program location.
In our example, the FPING program was found at:
Next, we need to edit the Zabbix server configuration file and enable the ICMP monitor feature.
On the Linux console, use the following commands to find the location of the zabbix_server configuration file.
Edit the configuration file.
Here is the original file, before our configuration.
Add at the end of this file.
Here is the new file with our configuration.
The Zabbix server was configured to start automatically 10 processes to collect ICMP PING information.
The Zabbix server was told the correct path to the FPING command.
Now, you need to restart the Zabbix service.
If you used our installation guide, you can restart Zabbix using the following command:
If the Zabbix server was started successfully, you should see a message similar to this on the log file:
In our example, the Zabbix server log file zabbix_server is located inside the TMP directory.
In our example, the Zabbix server started 10 ICMP PING data collector processes automatically.
Congratulations! you have enabled the feature required to monitor ICMP PING on Zabbix.
You can now use the Zabbix server dashboard to monitor ICMP PING.
Tutorial - Zabbix Monitor ICMP Ping
Now, we need to access the Zabbix server dashboard and add the Linux computer as a Host.
Open your browser and enter the IP address of your web server plus /zabbix.
In our example, the following URL was entered in the Browser:
• http://35.162.85.57/zabbix
On the login screen, use the default username and default password.
• Default Username: Admin
• Default Password: zabbix
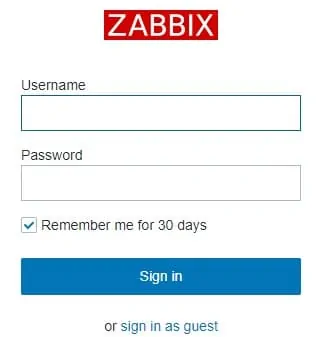
After a successful login, you will be sent to the Zabbix Dashboard.
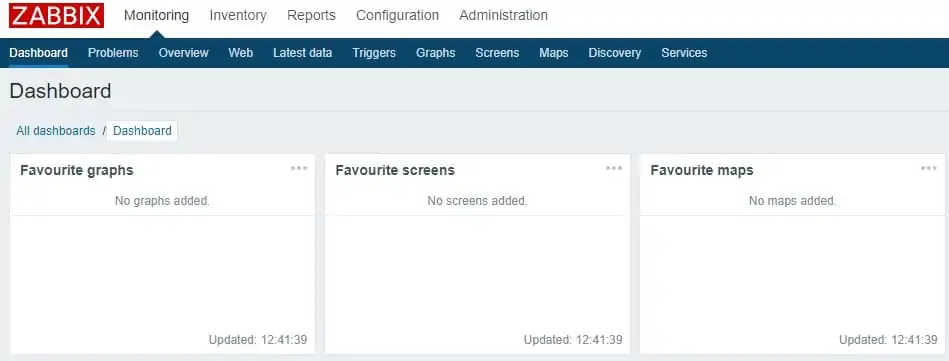
On the dashboard screen, access the Configuration menu and select the Host option.

On the top right of the screen, click on the Create host button.
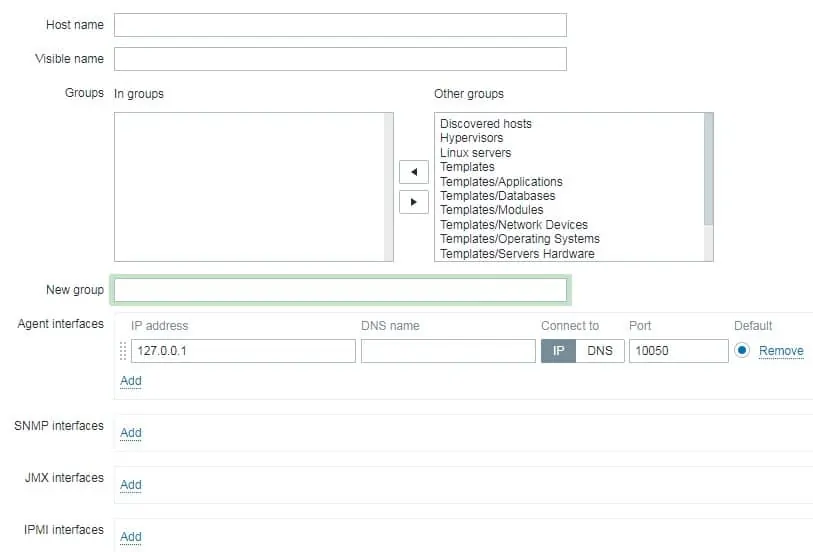
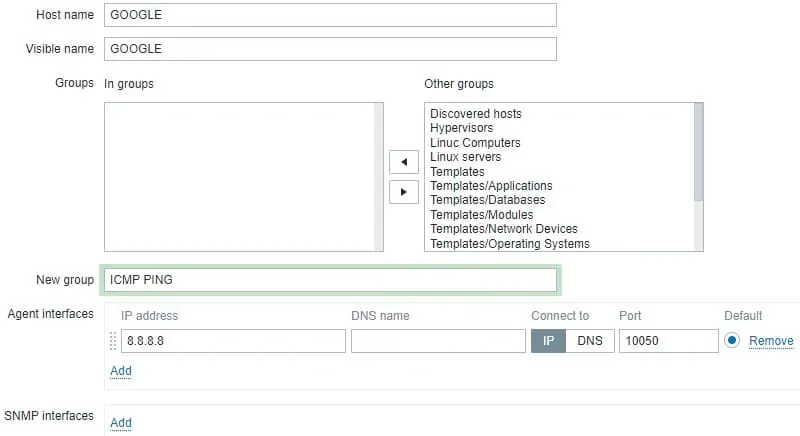
On the Host configuration screen, you will have to enter the following information:
• Host Name - Enter a Hostname to monitor.
• Visible Hostname - Repeat the hostname.
• New group - Enter a name to identify a group of similar devices.
• Agent Interface - Enter the IP address of the Hostname.
Here is the original image, before our configuration.
Here is the new image with our configuration.
Click on the Add button to include this host on the Zabbix database.
On the dashboard screen, access the Configuration menu and select the Host option.

Locate and click on the hostname that you created before.
In our example, we selected the hostname: GOOGLE
On the Host properties screen, access the Applications tab.
On the top right part of the screen, click on the Create application button.
On the Host applications screen, create a new application named TEST-ICMP.

After finishing the Application creation, access the Items tab.
On the top right part of the screen, click on the Create item button.
On the Item creation screen, you need to configure the following items:
• Name: Enter an identification to the ICMP monitoring item.
• Type: Simple check
• Type of Information: Numeric (Unsigned)
• Update interval: 60 Seconds
• Show value: Service State
• Application: TEST-ICMP
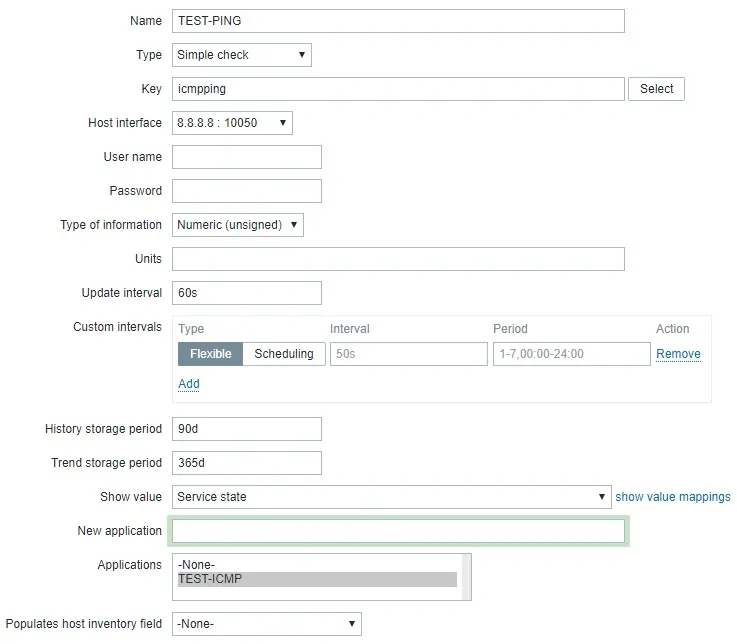
Click on the Add button and finish the Item creation.
Wait 5 minutes.
In order to test your configuration, access the Monitoring menu and click on the Latest data option.

Use the filter configuration to select the desired hostname.
In our example, we selected the hostname GOOGLE
Click on the Apply button.
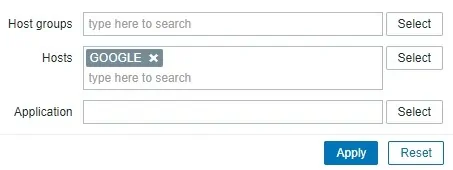
You should be able to see the results of your ICMP PING monitoring using Zabbix.

Congratulations! You have configured the Zabbix server to monitor a host using ICMP PING.
It is important to say that Zabbix comes with a very complete ICMP PING monitor template.
If you decide to use the ICMP template you don't have to do everything manually, as we did.
To use the Zabbix ICMP template, after adding a new host.
Access the Templates tab and associate the template named: Template module ICMP Ping

This video will show you how to monitor a host using the ICMP template.
