Would you like to learn how to monitor OPNSense using Zabbix? In this tutorial, we are going to show you how to install and configure the Zabbix agent software on a computer running OPNsense and how to monitor an OPNsense firewall using the Zabbix server.
• Zabbix server 4.2.6
• OPNsense 19.7
Equipment list
The following section presents the list of equipment used to create this tutorial.
As an Amazon Associate, I earn from qualifying purchases.
OPNsense - Related Tutorial:
On this page, we offer quick access to a list of tutorials related to OPNsense.
OPNsense - Zabbix Agent Installation
Open a browser software, enter the IP address of your Opnsense firewall and access web interface.
In our example, the following URL was entered in the Browser:
• https://192.168.15.11
The opnsense web interface should be presented.
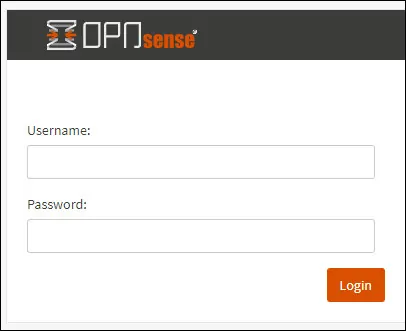
On the prompt screen, enter the OPNsense Default Password login information.
• Username: root
• Password: Password set during OPNsense the installation
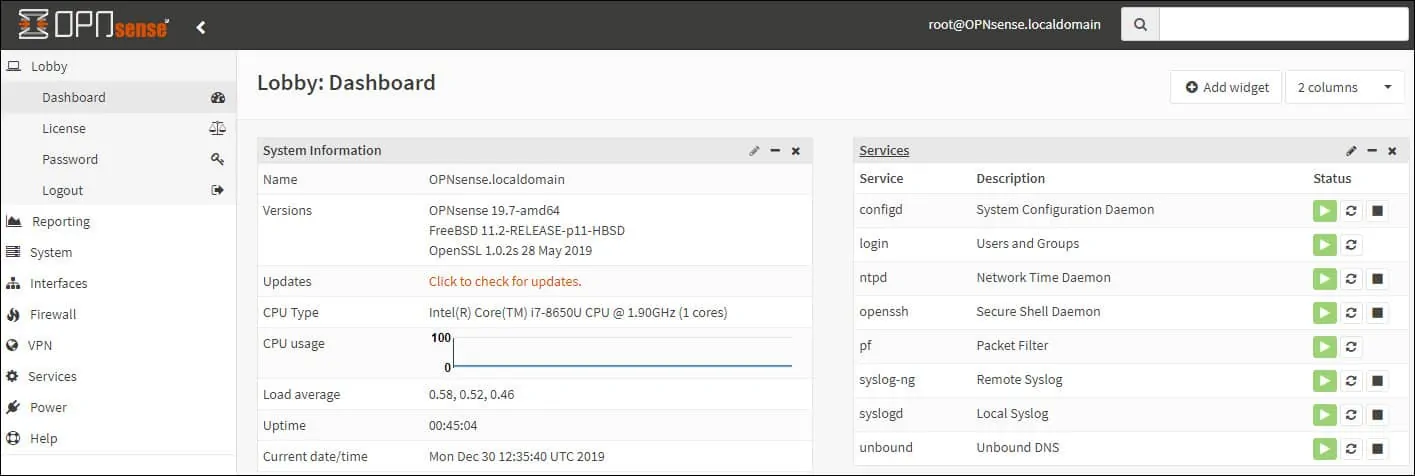
After a successful login, you will be sent to the OPNSense Dashboard.
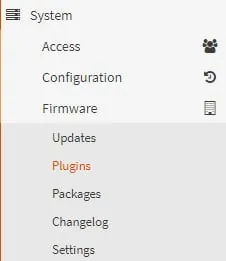
Access the Opnsense System menu, access the Firmware sub-menu and select the plugins option.
Locate and install the OPNsense plugin named: OS_ZABBIX-AGENT

In our example, we installed the Zabbix agent plugin version 1.5.
Wait the Zabbix agent plugin installation to finish.
You will need to logoff and login again.
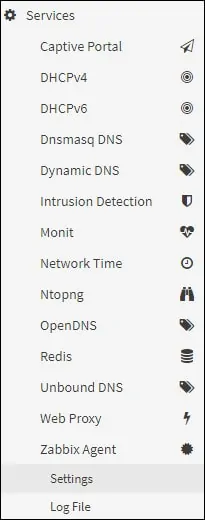
Access the OPNsense Services menu, access the Zabbix Agent sub-menu and select the Settins option.
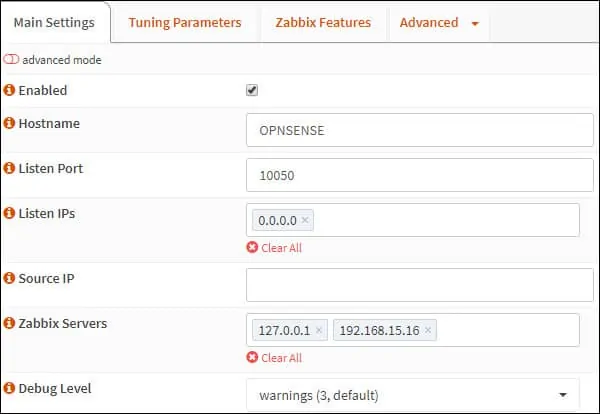
On the Main settings tab, enable the Zabbix agent service and perform the following configuration:
• Hostname - The hostname of the Opnsense firewall
• Listen Port - Zabbix agent default port 10050
• Listen IP - Use 0.0.0.0 to listen on All IP addresses
• Zabbix Servers - The IP address of the Zabbix server
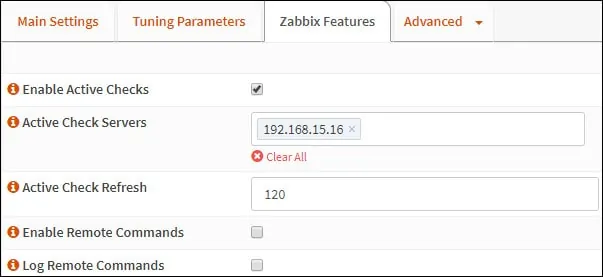
On the Zabbix features screen, perform the following configuration:
• Enable Active Checks - Yes
• Active Check Servers - The IP address of the Zabbix server
Click on the Apply button to finish the Zabbix agent configuration.
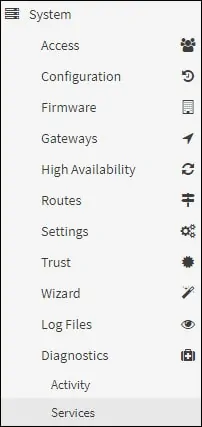
Access the Opnsense System menu, access the Diagnostics sub-menu and select the Services option
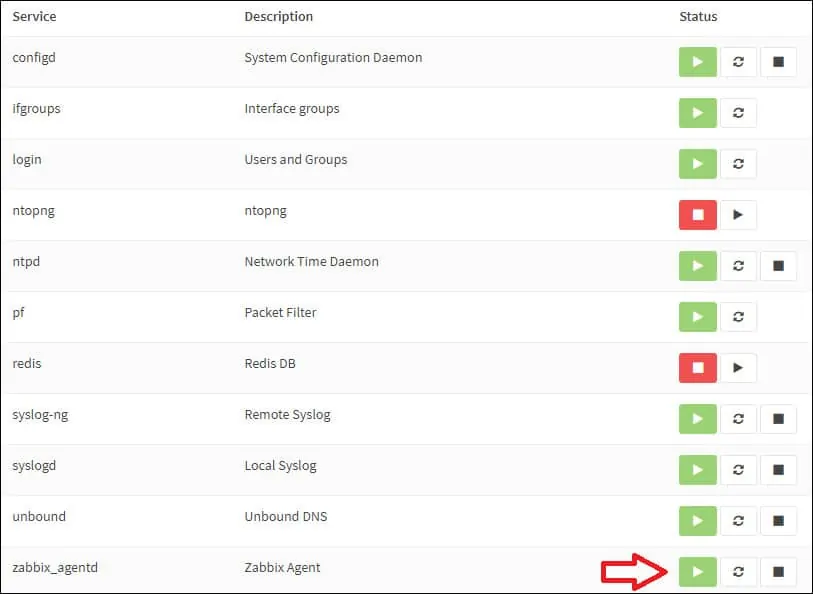
If the Zabbix agent service is not running, you may start the service manually.
You have successfully installed the OPNsense Zabbix agent.
OPNsense - Testing the Zabbix Agent Configuration
To test the OPNsense Zabbix agent configuration, access the command-line of your Zabbix server.
Use the following command to test the communication between the Zabbix server and the Zabbix agent.
If everything worked, the Zabbix agent should report the agent version installed on the OPNsense server.
Keep in mind that you need to change the Zabbix agent IP address to reflect your environment.
You have successfully performed a communication test between the Zabbix server and the Zabbix agent.
You can now use the Zabbix server dashboard to add this computer to the network monitoring service.
Tutorial Zabbix - Monitoring OPNsense
Now, we need to access the Zabbix server dashboard and add the OPNsense server as a Host.
Open your browser and enter the IP address of your web server plus /zabbix.
In our example, the following URL was entered in the Browser:
• http://192.168.15.10/zabbix
On the login screen, use the default username and default password.
• Default Username: Admin
• Default Password: zabbix
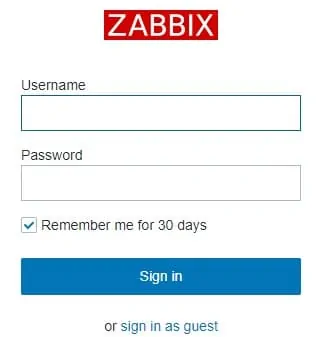
After a successful login, you will be sent to the Zabbix Dashboard.
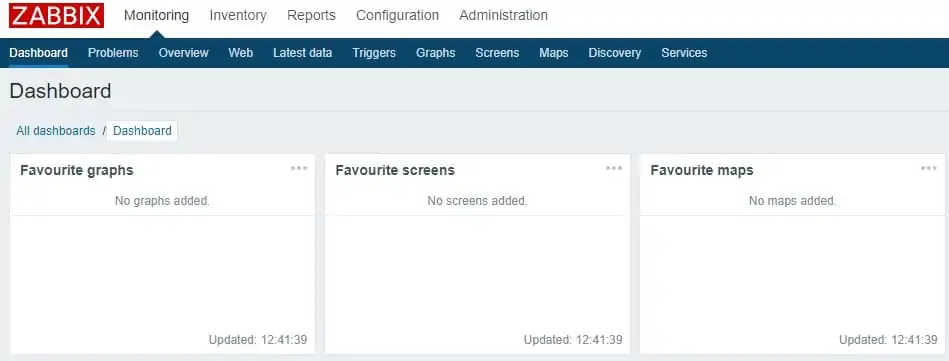
On the dashboard screen, access the Configuration menu and select the Host option.

On the top right of the screen, click on the Create host button.
On the Host configuration screen, you will have to enter the following information:
• Host Name - Enter a Hostname to identify the OPNsense server.
• Visible Hostname - Repeat the hostname.
• New group - Enter a name to identify a group of similar devices.
• Agent Interface - Enter the IP address of the OPNsense server.
Here is the original image, before our configuration.
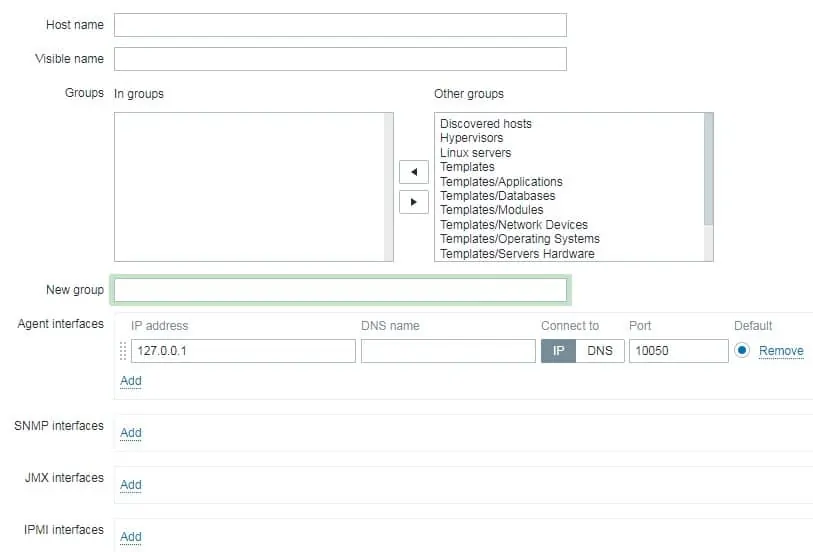
Here is the new image with our configuration.

Next, we need to associate the host with a specific network monitor template.
By default, Zabbix comes with a large variety of monitoring templates.
Access the Templates tab on the top of the screen.
Click on the Select button and locate the template named: Template OS FreeBSD
Click on the Add option (1).
Click on the Add button to finish the configuration.

After a few minutes, you will be able to see the initial result on the Zabbix Dashboard.
The final result will take at least one hour.
By default, Zabbix will wait 1 hour to discover the number of interfaces available on the OPNsense server.
By default, Zabbix will wait 1 hour before collect information from the network interfaces.
In order to test your configuration, access the Monitoring menu and click on the Graphs option.

On the top right of the screen, select the group named ALL.
Select your OPNsense computer host name.
Select the graph named: CPU UTILIZATION
You should be able to see the graphic of CPU utilization.
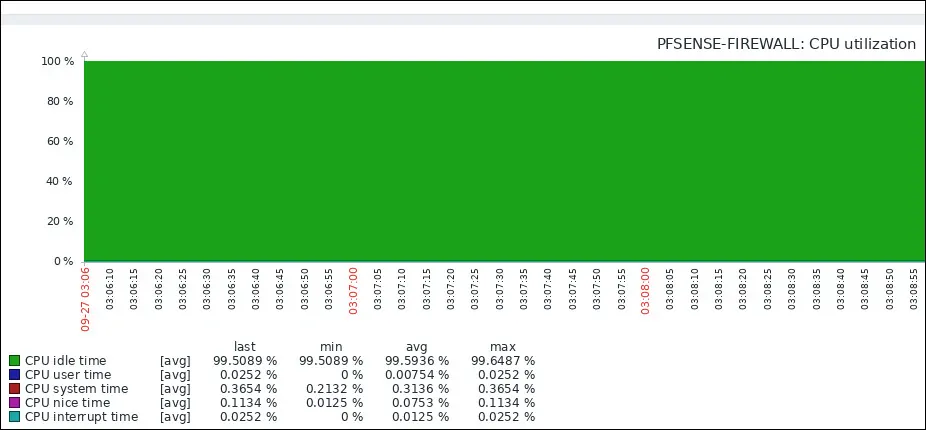
Congratulations! You have configured the Zabbix server to monitor a OPNsense computer.
