Would you like to learn how to monitor a PostgreSQL server using Zabbix? In this tutorial, we are going to show you how to use Zabbix to monitor a PostgreSQL server.
Zabbix Playlist:
On this page, we offer quick access to a list of videos related to Zabbix installation.
Don't forget to subscribe to our youtube channel named FKIT.
Zabbix Related Tutorial:
On this page, we offer quick access to a list of tutorials related to Zabbix installation.
Configure a PostgreSQL user to Zabbix
• IP - 192.168.15.11
• Operational System - Ubuntu 19.10
• Hostname - POSTGRESQL
Zabbix requires an account to access the PostgreSQL server and perform the database monitoring.
On the PostgreSQL database server, create an account to Zabbix.
Give monitoring privilege over all PostgreSQL databases to the Zabbix user.
Take note of the PostgreSQL username and password created.
Locate and edit the pg_hba.conf configuration file.
Add the following lines at the beginning of this file.
Here is our pg_hba.conf file content:
Restart the PostgreSQL service.
Test if you are able to connect to the local PostgreSQL server using the zbx_monitor account.
The system should not ask for a password.
You have finished the PostgreSQL service configuration.
Install the Zabbix Agent on the PostgreSQL Server
• IP - 192.168.15.11
• Operational System - Ubuntu 19.10
• Hostname - POSTGRESQL
Now, we need to install the Zabbix agent on the computer running the PostgreSQL service.
On the Linux console, use the following commands to install the required packages.
Download the Zabbix installation package.
Extract the Zabbix installation package, compile and install the Zabbix agent.
Find the location of the zabbix_agentd.conf file on your system.
Edit the zabbix_agentd.conf file.
Here is the original file, before our configuration.
Here is the new file with our configuration.
In our example, the Zabbix agent is configured to allow the connection from the Zabbix server 192.168.15.10.
The Zabbix server with the IP address 192.168.15.10 is allowed to request and receive information from this agent.
The Localhost, 127.0.0.1, is allowed to request and receive information from the agent.
Create the following required directories.
Download the Zabbix source code from Github.
Copy the required files to monitor the PostgreSQL server from the Zabbix repository.
The Zabbix installation package comes with a service startup script.
Copy the startup script using the commands below.
You can now use the following commands to start the Zabbix agent service.
In our example, the Zabbix agent will monitor the PostgreSQL service installed on the localhost.
Restart the Zabbix Agent.
You have finished the Zabbix agent installation.
You can now use the Zabbix server dashboard to add this computer to the network monitoring service.
Zabbix Monitor PostgreSQL
Access the Zabbix server dashboard and add the Linux computer running PostgreSQL as a Host.
Open your browser and enter the IP address of your web server plus /zabbix.
In our example, the following URL was entered in the Browser:
• http://192.168.15.10/zabbix
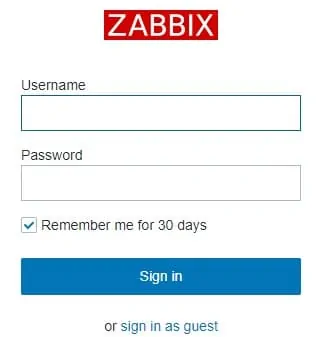
On the login screen, use the default username and default password.
• Default Username: Admin
• Default Password: zabbix

After a successful login, you will be sent to the Zabbix Dashboard.

On the dashboard screen, access the Configuration menu and select the Host option.

On the top right of the screen, click on the Create host button.
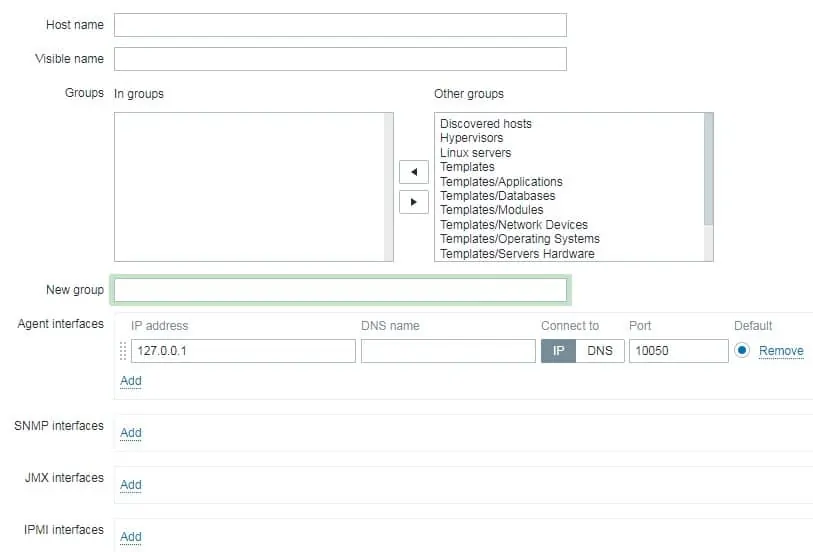
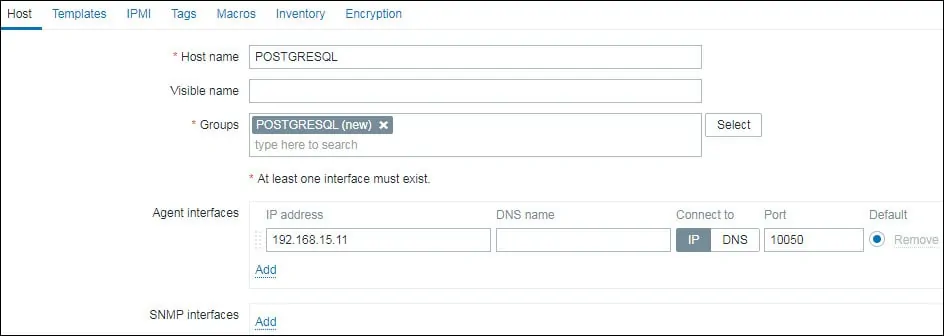
Enter the following information:
• Host Name - Enter a Hostname to identify the Linux server running PostgreSQL.
• Visible Hostname - Repeat the hostname.
• Group - Select the name of a group to identify similar devices.
• Agent Interface - Enter the IP address of the Linux server.
Here is the original image, before our configuration.

Here is the new image with our configuration.

Next, we need to associate the host with a specific network monitor template.
By default, Zabbix comes with a large variety of monitoring templates.
Access the Templates tab on the top of the screen.
Click on the Select button and locate the template named: Template DB PostgreSQL

Click on the Add option.
Click on the Add button.
After a few minutes, you will be able to see the initial result on the Zabbix Dashboard.
In order to test your configuration, access the Monitoring menu and click on the Graphs option.

On the top right of the screen, select the group named ALL.
Select your PostgreSQL computer hostname.
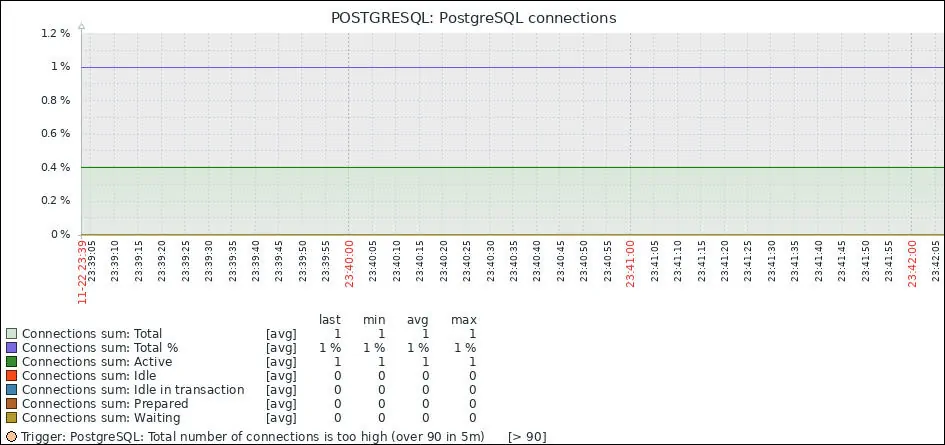
Select the graph named: PostgreSQL connections
You should be able to see the graphic named PostgreSQL connections

Congratulations! You have configured the Zabbix server to monitor PostgreSQL.
