Would you like to learn how to monitor a Vmware ESXi computer using SNMP? In this tutorial, we are going to show you how to configure SNMP on Vmware ESXi and how to configure the Zabbix server to monitor a Vmware ESXi without the need to install the Zabbix agent.
This tutorial was tested on Vmware ESXi 6
This tutorial was tested on Vmware ESXi 6.5
This tutorial was tested on Zabbix 3.4
Hardware List:
The following section presents the list of equipment used to create this Zabbix tutorial.
Every piece of hardware listed above can be found at Amazon website.
Zabbix Playlist:
On this page, we offer quick access to a list of videos related to Zabbix installation.
Don't forget to subscribe to our youtube channel named FKIT.
Zabbix Related Tutorial:
On this page, we offer quick access to a list of tutorials related to Zabbix installation.
VMware ESXi Related Tutorial:
On this page, we offer quick access to a list of tutorials related to Vmware Esxi.
Tutorial - SNMP Configuration on VMware ESXi
Now, we need to configure the SNMP service on Vmware ESXi.
On the Vmware console, use the following commands to configure SNMP.
The GokuBlack Community has read-only permission on the Vmware ESXi server.
The contact person responsible for this server was configured as Zamasu.
The location of the equipment was configured as the IT Room of Universe 10.
You have successfully configured the Vmware ESXi SNMP service.
To test your SNMP configuration, use the following commands on the Zabbix server console.
Here is a small sample of the SNMPWALK output.
Congratulations! you have configured the SNMP service on a computer running Vmware ESXi.
You can now use the Zabbix server dashboard to add this computer to the network monitoring service.
Tutorial - Zabbix Monitor Vmware ESXi using SNMP
Now, we need to access the Zabbix server dashboard and add the Vmware ESXi computer as a Host.
Open your browser and enter the IP address of your web server plus /zabbix.
In our example, the following URL was entered in the Browser:
• http://35.162.85.57/zabbix
On the login screen, use the default username and default password.
• Default Username: Admin
• Default Password: zabbix
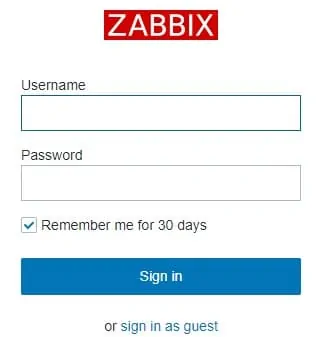
After a successful login, you will be sent to the Zabbix Dashboard.
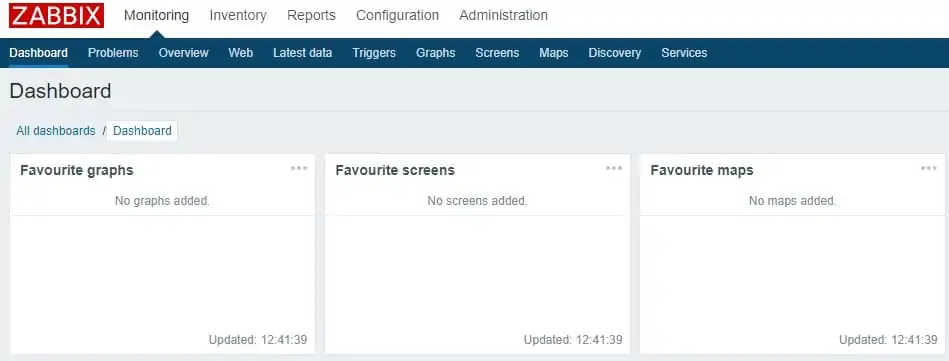
On the dashboard screen, access the Configuration menu and select the Host option.

On the top right of the screen, click on the Create host button.
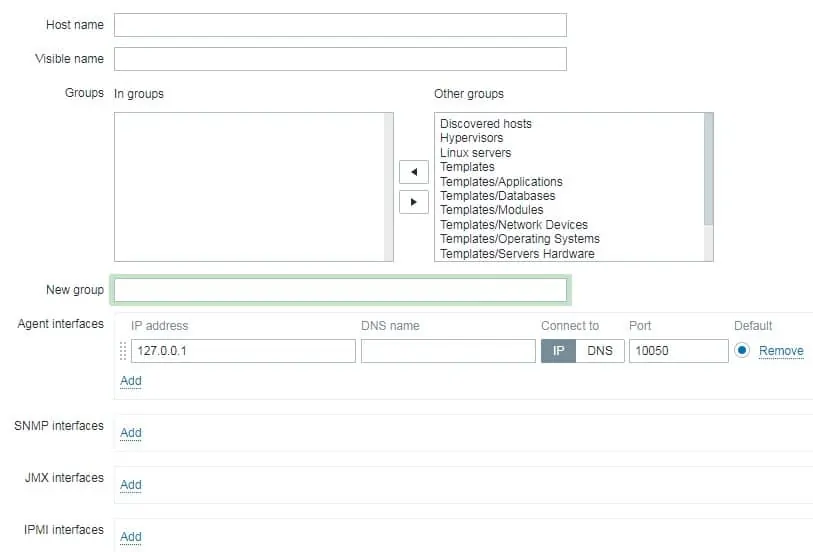
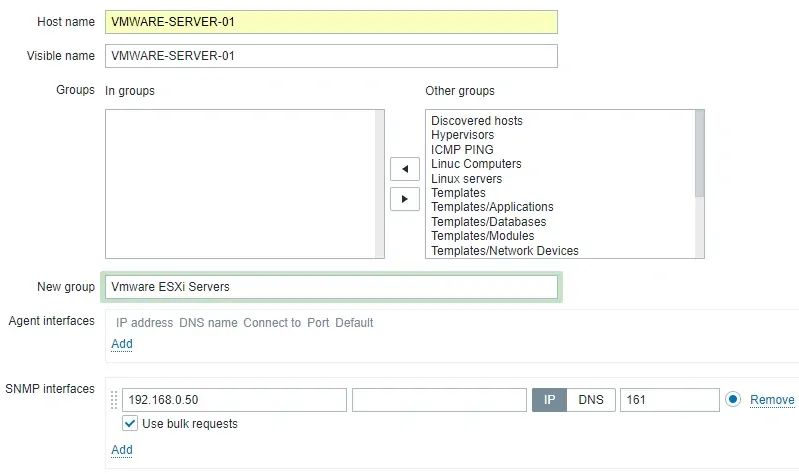
On the Host configuration screen, you will have to enter the following information:
• Host Name - Enter a Hostname to identify the Vmware ESXi server.
• Visible Hostname - Repeat the hostname.
• New group - Enter a name to identify a group of similar devices.
• Agent Interface - Click on the Remove option.
• SNMP Interface - Enter the IP address of the Vmware ESXi server.
Here is the original image, before our configuration.
Here is the new image with our configuration.
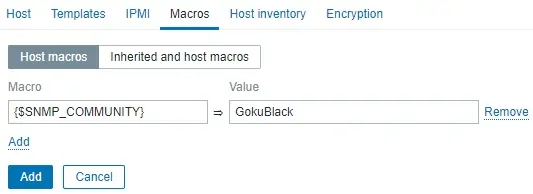
Next, we need to configure the SNMP community that Zabbix will use to connect on the Vmware ESXi server.
Access the Macros tab on the top of the screen.
Create a macro named:
The macro value should be the Vmware ESXi SNMP community.
Next, we need to associate the host with a specific network monitor template.
By default, Zabbix comes with a large variety of monitoring templates.
Access the Templates tab on the top of the screen.
Click on the Select button and locate the template named: Template OS LINUX SNMPv2

Click on the Add button (1).
Click on the Add button (2).
After a few minutes, you will be able to see the initial result on the Zabbix Dashboard.
The final result will take at least one hour.
By default, Zabbix will wait 1 hour to discover the number of interfaces on the Vmware ESXi server.
By default, Zabbix will wait 1 hour before collect information from the network interfaces.
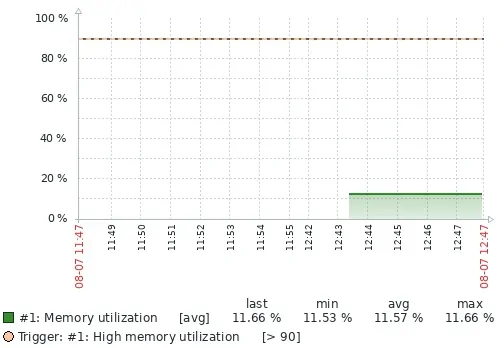
In order to test your configuration, access the Monitoring menu and click on the Graphs option.
Wait 1 hour before trying to access the Vmware ESXi computer graph.

On the top right of the screen, select the group named ALL.
Select your Vmware ESXi computer host name.
Select the graph named: MEMORY UTILIZATION
You should be able to see the graphic of Memory utilization.
Congratulations! You have configured the Zabbix server to monitor a Vmware ESXi server using SNMP.
